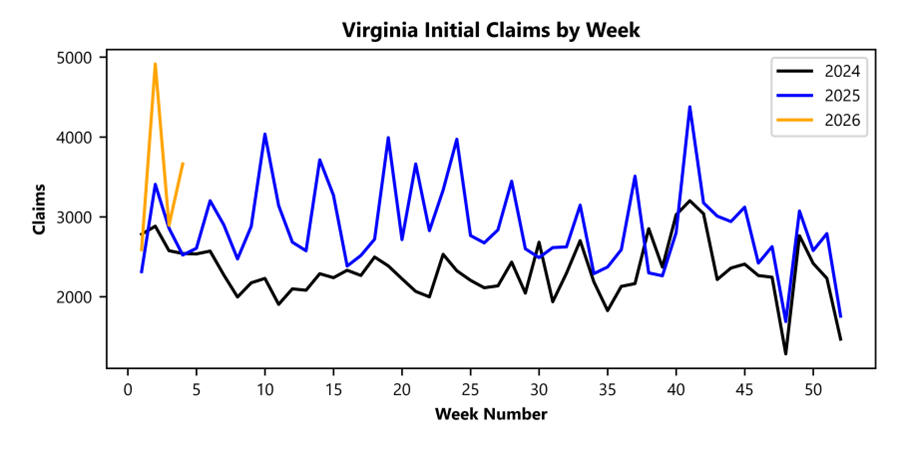
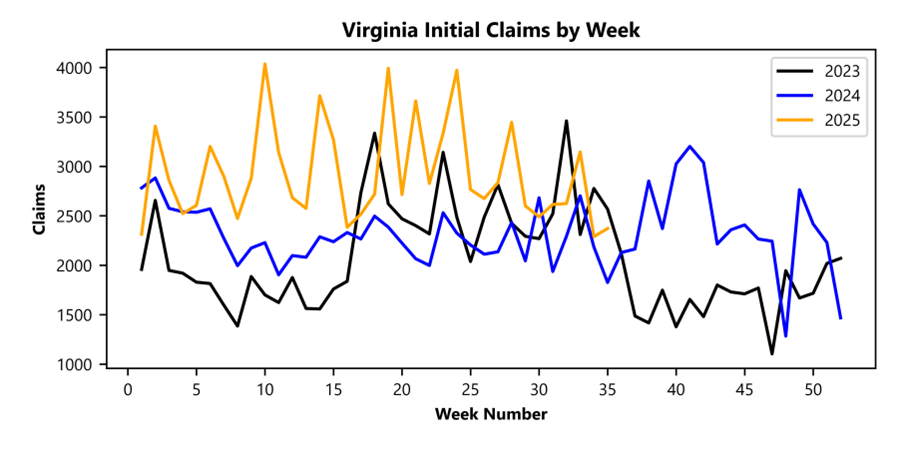
RICHMOND— Virginia Works’ Economic Information and Analytics Division, which serves as the Commonwealth’s official source for labor market and workforce data, reported that that 2,653 unemployment insurance weekly initial claims were filed during the week ending February 14, 2026. The claims were filed with the Virginia Employment Commission, which administers the Commonwealth’s Unemployment Insurance program. This is 42.2 percent lower than last week’s 4,592 claims and 8.5 percent lower than the comparable week of last year (2,899). Nearly 83 percent of claimants self-reported an employer which correlates to an associated industry. Based on this reporting, the top five industries (60 percent) were Professional, Scientific, and Technical Services (361); Administrative and Support and Waste Management (264); Health Care and Social Assistance (261); Retail Trade (214); and Manufacturing (209).
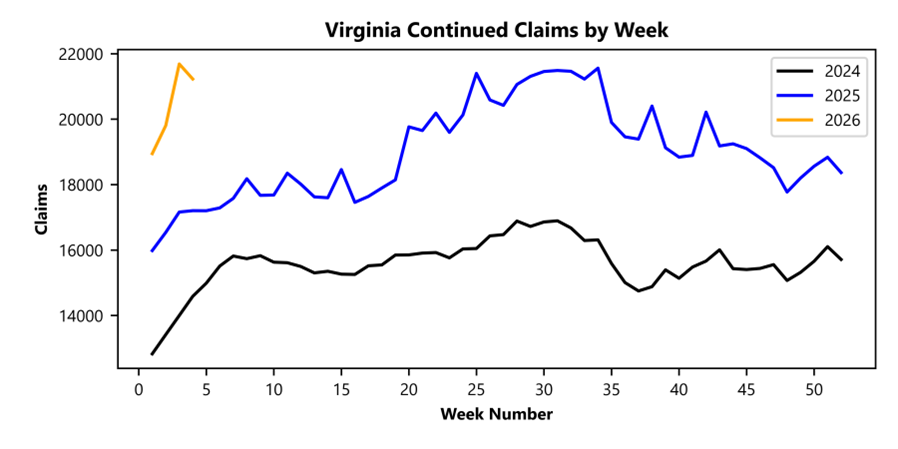
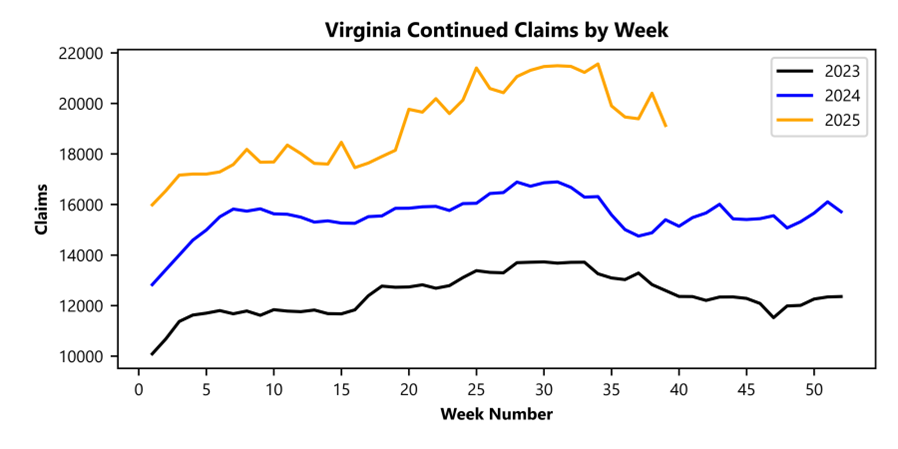
Continued weeks’ claims (21,841) were 2.6 percent higher than last week (21,291) and were 24.2 percent higher than the comparable week of last year (17,579). Nearly 92 percent of claimants self-reported an employer which correlates to an associated industry. Based on this reporting, the top five industries (61 percent) were Professional, Scientific, and Technical Services (4,082); Administrative and Support and Waste Management (2,520); Manufacturing (2,297); Construction (1,734); and Health Care and Social Assistance (1,642).
Significant Layoffs and Announcements are available at the following websites:
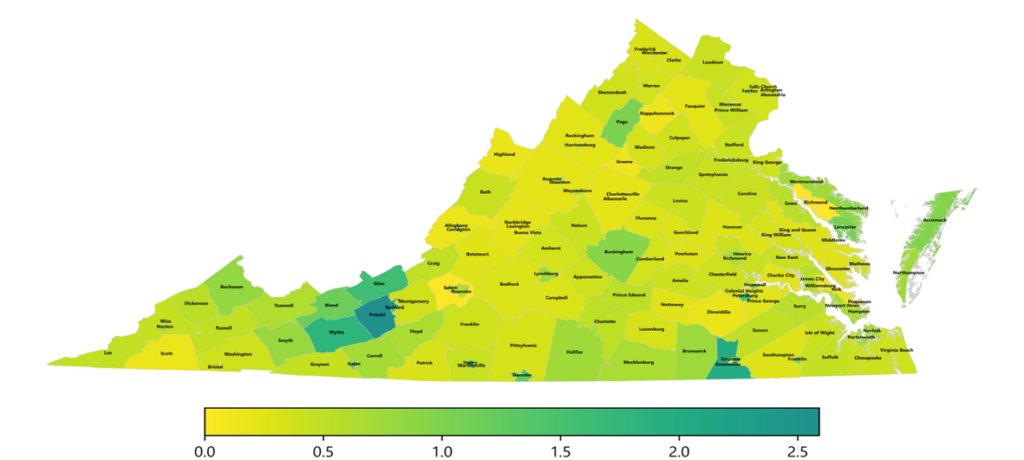
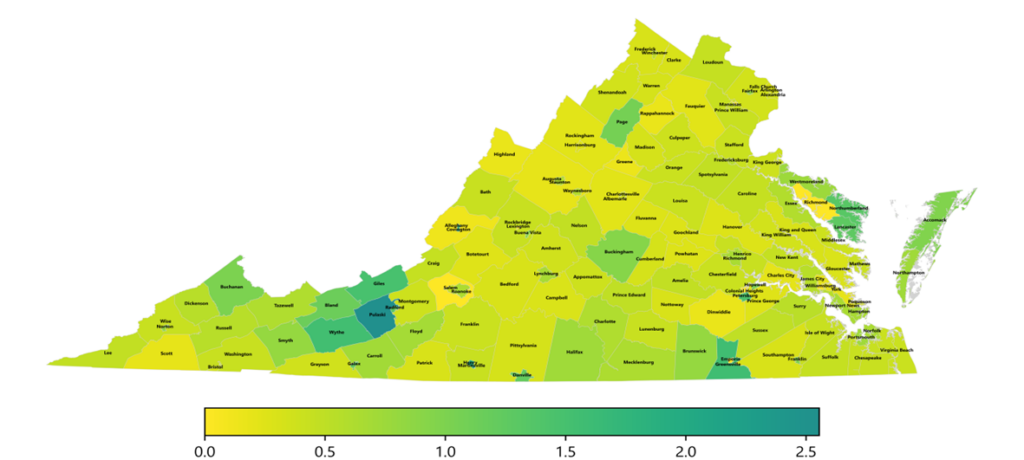
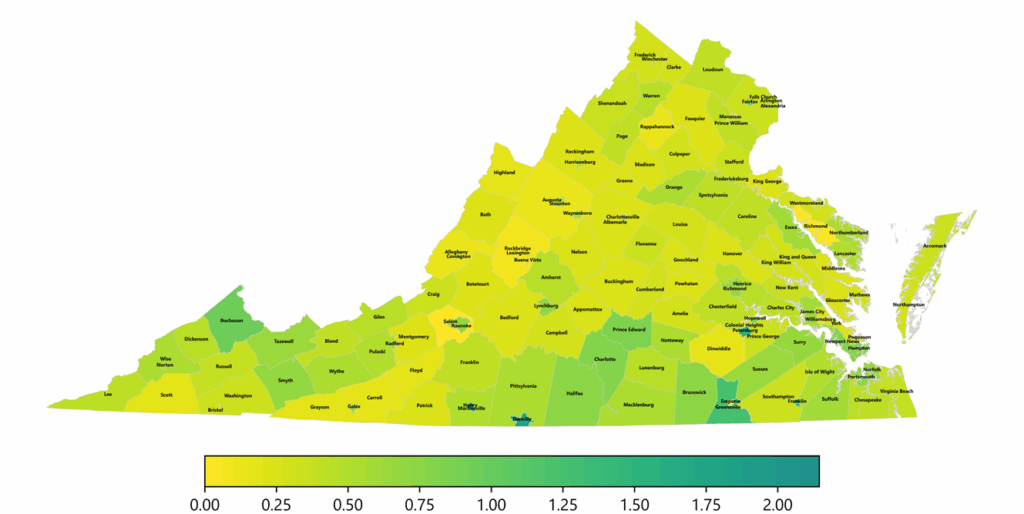
Virginia Continued Weeks Claimed as a Percentage of Total Workforce
A person who has already filed an initial claim and who has experienced a week of unemployment files a continued claim to claim benefits for that week of unemployment. On a weekly basis, continued claims reflect a good approximation of the current number of insured unemployed workers filing for UI benefits, and are a good indicator of labor market conditions. While continued claims are not a leading indicator, they provide confirming evidence of the direction of the economy.
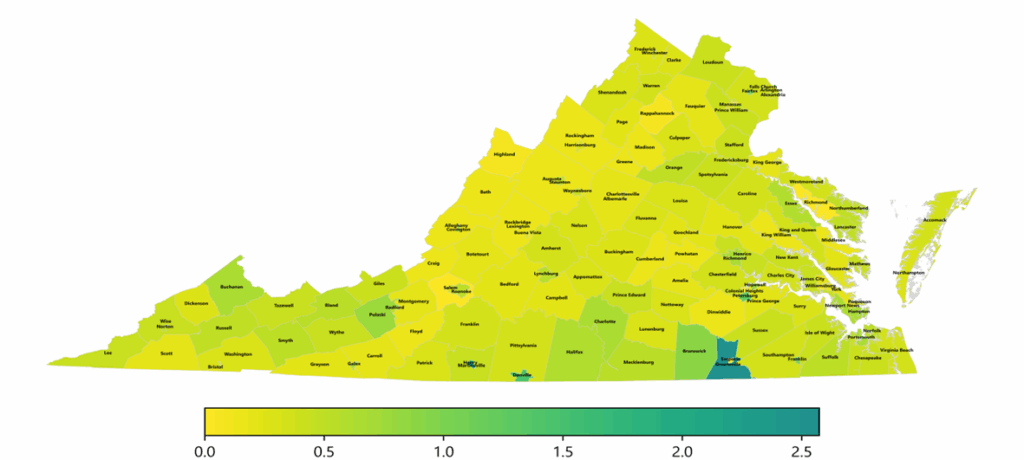
The color-coded map below shows the distribution of this week’s continued claims in Virginia’s counties and cities, expressed as a percentage of each locality’s labor force. This approach provides a more meaningful comparison across areas by adjusting for differences in labor force size. Yellow represents a lower percentage of continued claims relative to the labor force, while progressively darker shades transitioning from yellow to green and dark green indicate higher percentages. The legend at the bottom shows the color spectrum and its corresponding percentage ranges.
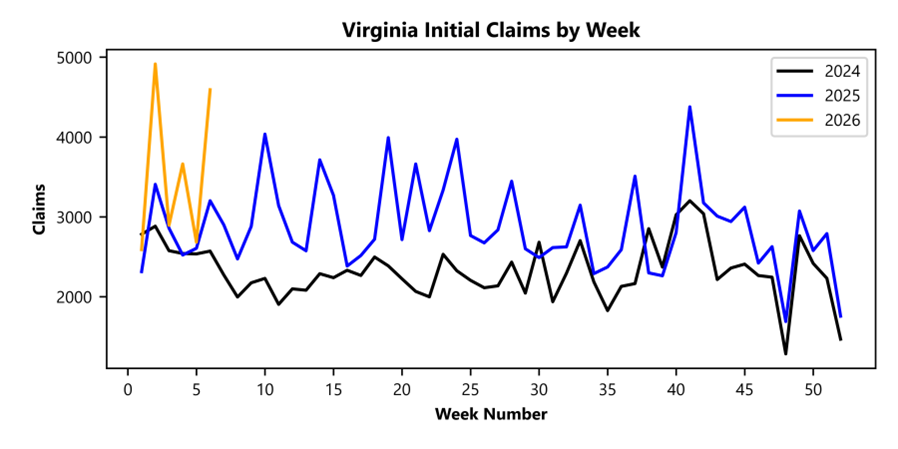
RICHMOND— Virginia Works’ Economic Information and Analytics Division, which serves as the Commonwealth’s official source for labor market and workforce data, reported that 4,592 initial unemployment insurance claims were filed in Virginia during the week ending February 07, 2026. The claims were filed with the Virginia Employment Commission, which administers the Commonwealth’s Unemployment Insurance program. This represents a 71.2 percent increase from the prior week’s 2,683 claims and is 43.4 percent higher than the comparable week last year (3,202). Nearly 80 percent of claimants self-reported an employer which correlates to an associated industry. Based on this reporting, the top five industries (68 percent) were Manufacturing (1,184); Professional, Scientific, and Technical Services (431); Administrative and Support and Waste Management (322); Construction (259); and Retail Trade (220).
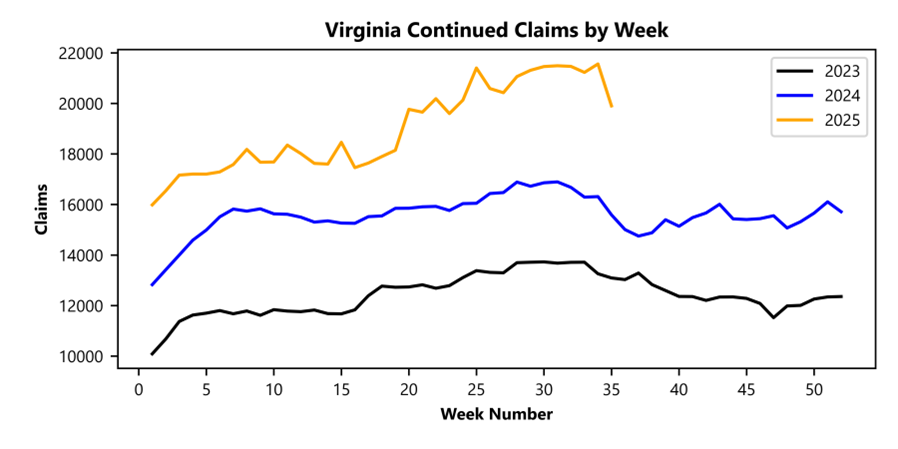
Continued weeks’ claims (21,291) were 0.5 percent lower than last week (21,403) and were 23.2 percent higher than the comparable week of last year (17,288). Nearly 92 percent of claimants self-reported an employer which correlates to an associated industry. Based on this reporting, the top five industries (61 percent) were Professional, Scientific, and Technical Services (3,999); Administrative and Support and Waste Management (2,493); Manufacturing (2,058); Construction (1,688); and Health Care and Social Assistance (1,634).
Significant Layoffs and Announcements are available at the following websites:
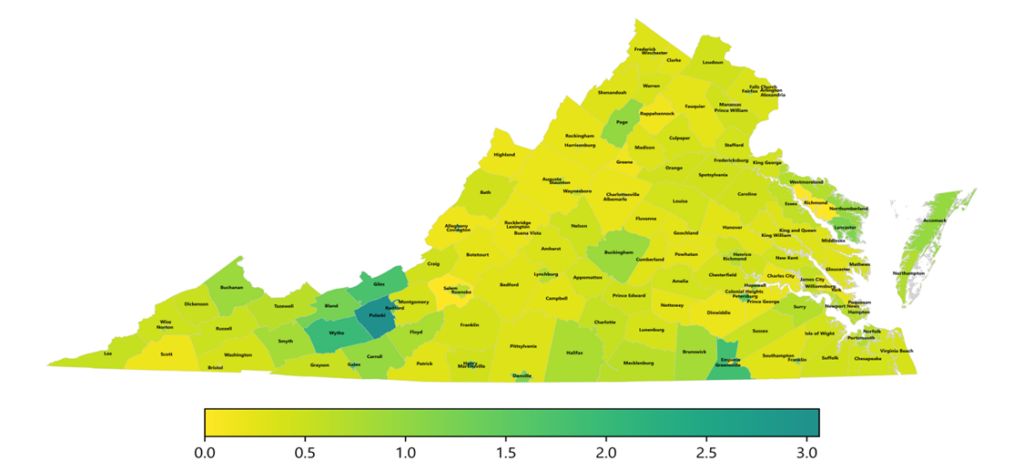
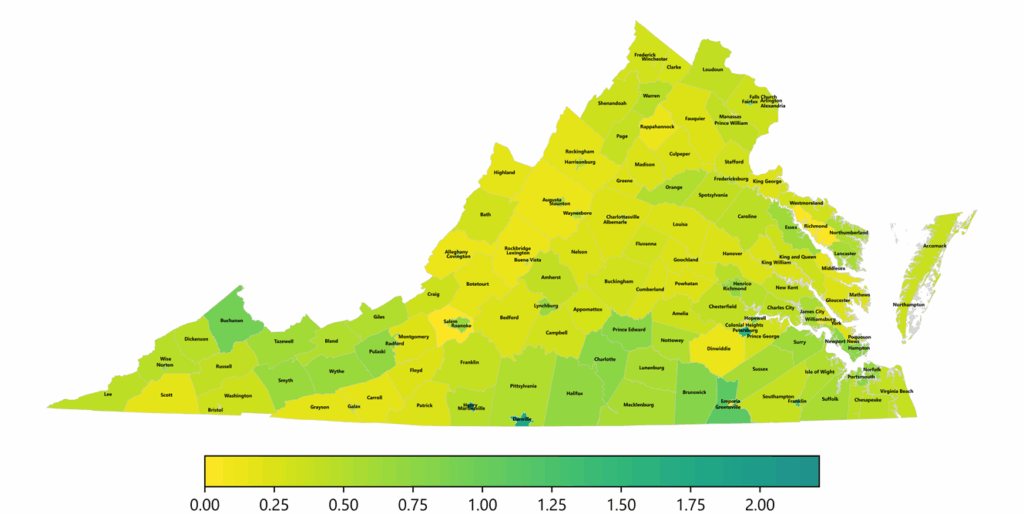
Virginia Continued Weeks Claimed as a Percentage of Total Workforce
A person who has already filed an initial claim and who has experienced a week of unemployment files a continued claim to claim benefits for that week of unemployment. On a weekly basis, continued claims reflect a good approximation of the current number of insured unemployed workers filing for UI benefits, and are a good indicator of labor market conditions. While continued claims are not a leading indicator, they provide confirming evidence of the direction of the economy.
The color-coded map below shows the distribution of this week’s continued claims in Virginia’s counties and cities, expressed as a percentage of each locality’s labor force. This approach provides a more meaningful comparison across areas by adjusting for differences in labor force size. Yellow represents a lower percentage of continued claims relative to the labor force, while progressively darker shades transitioning from yellow to green and dark green indicate higher percentages. The legend at the bottom shows the color spectrum and its corresponding percentage ranges.
RICHMOND— Virginia Works announced today that 2,683 unemployment insurance weekly initial claims were filed during the week ending January 31, 2026, which is 26.8 percent lower than last week’s 3,663 claims and 3.0 percent higher than the comparable week of last year (2,606). Nearly 80 percent of claimants self-reported an employer which correlates to an associated industry. Based on this reporting, the top five industries (60 percent) were Professional, Scientific, and Technical Services (310); Administrative and Support and Waste Management (263); Construction (219); Health Care and Social Assistance (217); and Manufacturing (207).
Continued weeks claims (21,403) were 0.8 percent higher than last week (21,226) and were 24.4 percent higher than the comparable week of last year (17,201). Nearly 91 percent of claimants self-reported an employer which correlates to an associated industry. Based on this reporting, the top five industries (61 percent) were Professional, Scientific, and Technical Services (4,028); Administrative and Support and Waste Management (2,484); Manufacturing (2,221); Health Care and Social Assistance (1,584); and Construction (1,569).
Significant Layoffs and Announcements are available at the following websites:
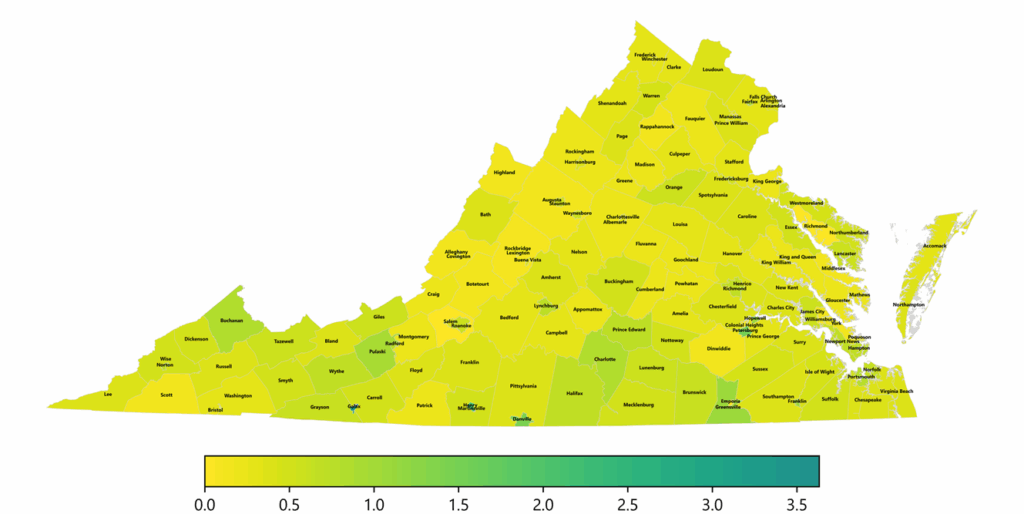
Virginia Continued Weeks Claimed as a Percentage of Total Workforce
A person who has already filed an initial claim and who has experienced a week of unemployment files a continued claim to claim benefits for that week of unemployment. On a weekly basis, continued claims reflect a good approximation of the current number of insured unemployed workers filing for UI benefits, and are a good indicator of labor market conditions. While continued claims are not a leading indicator, they provide confirming evidence of the direction of the economy.
The color-coded map below shows the distribution of this week’s continued claims in Virginia’s counties and cities, expressed as a percentage of each locality’s labor force. This approach provides a more meaningful comparison across areas by adjusting for differences in labor force size. Yellow represents a lower percentage of continued claims relative to the labor force, while progressively darker shades transitioning from yellow to green and dark green indicate higher percentages. The legend at the bottom shows the color spectrum and its corresponding percentage ranges.
RICHMOND— Virginia Works announced today that 2,262 unemployment insurance weekly initial claims were filed during the week ending September 27, 2025, which is 1.6 percent lower than last week’s 2,298 claims and 4.6 percent lower than the comparable week of last year (2,371). Nearly 80 percent of claimants self-reported an employer which correlates to an associated industry. Based on this reporting, the top five industries (62 percent) were Professional, Scientific, and Technical Services (363); Health Care and Social Assistance (217); Administrative and Support and Waste Management (208); Retail Trade (181); and Manufacturing (142).
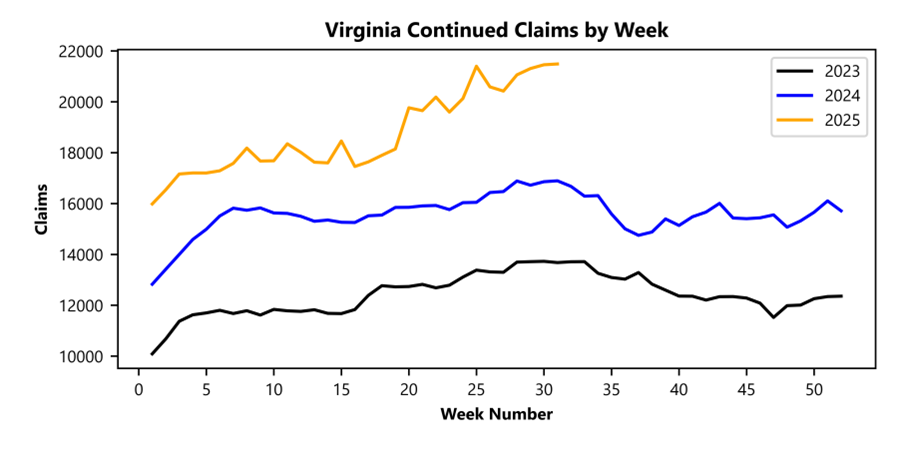
Continued weeks claims (19,125) were 6.3 percent lower than last week (20,400) and were 24.2 percent higher than the comparable week of last year (15,395). Nearly 92 percent of claimants self-reported an employer which correlates to an associated industry. Based on this reporting, the top five industries (64 percent) were Professional, Scientific, and Technical Services (4,592); Administrative and Support and Waste Management (2,236); Health Care and Social Assistance (1,648); Retail Trade (1,463); and Manufacturing (1,406).
Significant Layoffs and Announcements are available at the following websites:
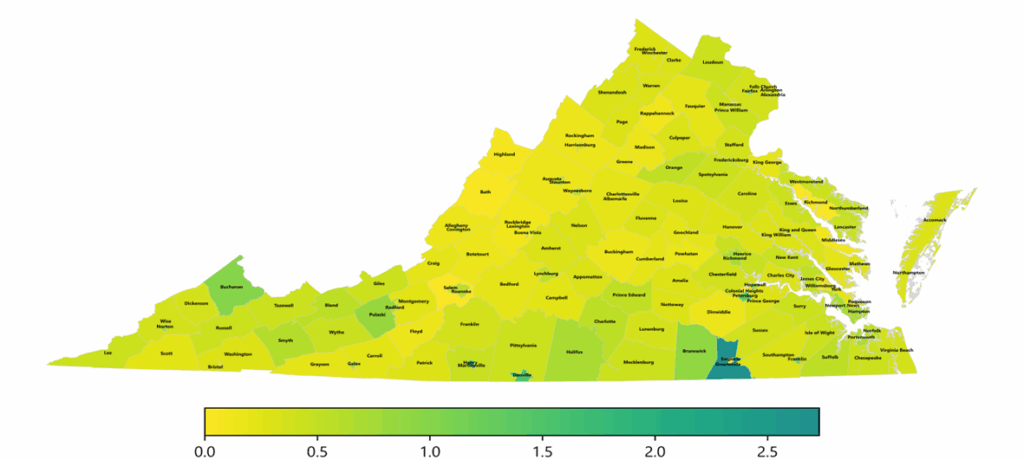
Virginia Continued Weeks Claimed as a Percentage of Total Workforce
A person who has already filed an initial claim and who has experienced a week of unemployment files a continued claim to claim benefits for that week of unemployment. On a weekly basis, continued claims reflect a good approximation of the current number of insured unemployed workers filing for UI benefits, and are a good indicator of labor market conditions. While continued claims are not a leading indicator, they provide confirming evidence of the direction of the economy.
The color-coded map below shows the distribution of this week’s continued claims in Virginia’s counties and cities, expressed as a percentage of each locality’s labor force. This approach provides a more meaningful comparison across areas by adjusting for differences in labor force size. Yellow represents a lower percentage of continued claims relative to the labor force, while progressively darker shades transitioning from yellow to green and dark green indicate higher percentages. The legend at the bottom shows the color spectrum and its corresponding percentage ranges.
RICHMOND— Virginia Works announced today that 2,372 unemployment insurance weekly initial claims were filed during the week ending August 30, 2025, which is 3.6 percent higher than last week’s 2,289 claims and 29.9 percent higher than the comparable week of last year (1,826). Nearly 81 percent of claimants self-reported an employer which correlates to an associated industry. Based on this reporting, the top five industries (60 percent) were Professional, Scientific, and Technical Services (353); Administrative and Support and Waste Management (228); Health Care and Social Assistance (201); Manufacturing (192); and Retail Trade (174).
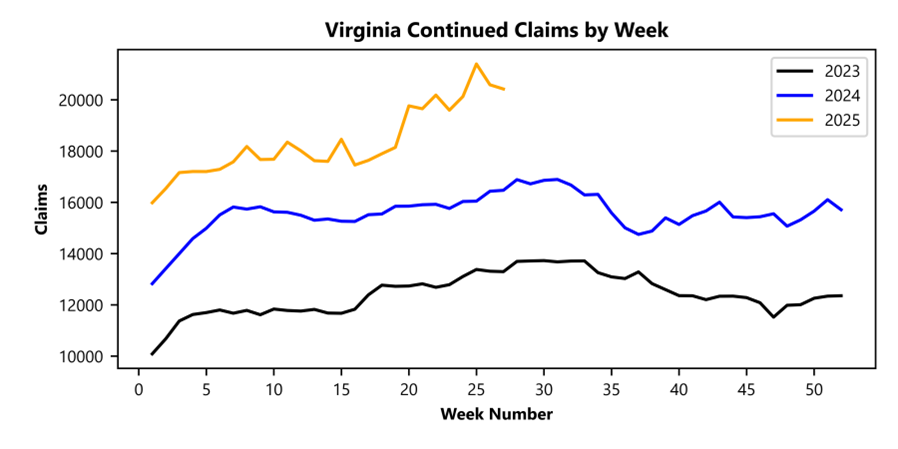
Continued weeks claims (19,900) were 7.7 percent lower than last week (21,559) and were 27.7 percent higher than the comparable week of last year (15,589). Nearly 92 percent of claimants self-reported an employer which correlates to an associated industry. Based on this reporting, the top five industries (64 percent) were Professional, Scientific, and Technical Services (4,746); Administrative and Support and Waste Management (2,324); Health Care and Social Assistance (1,694); Manufacturing (1,516); and Retail Trade (1,496).
Significant Layoffs and Announcements are available at the following websites:
Initial Claims – Comparison of Unemployment Insurance Activity
Week Ending08/30/2025
Week Ending08/23/2025
Week Ending08/16/2025
Last Year08/31/2024
Initial Claims
2,372
2,289
3,146
1,826
Initial Change (%)
+83 (+3.6%)
-857 (-27.2%)
+522 (+19.9%)
+546 (+29.9%)
Continued Claims
19,900
21,559
21,225
15,589
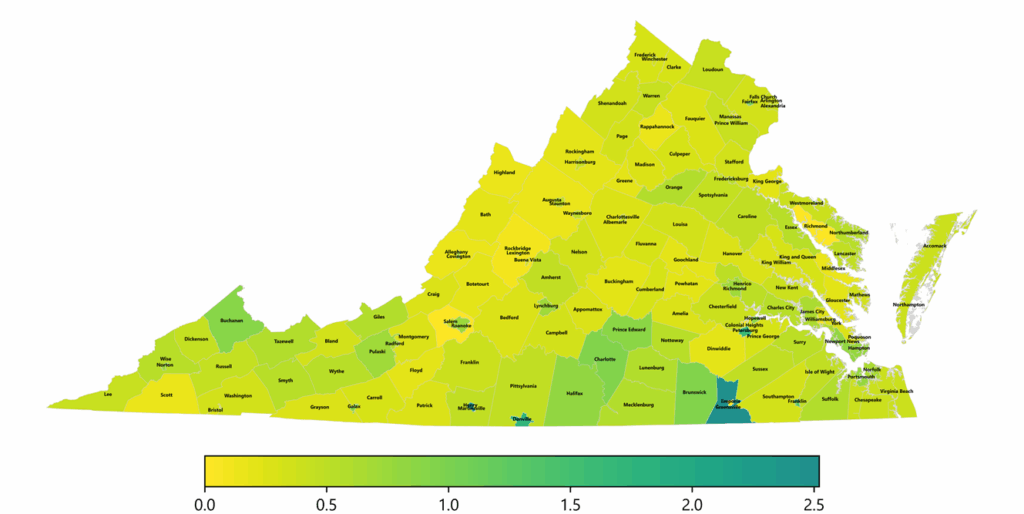
Virginia Continued Weeks Claimed as a Percentage of Total Workforce
A person who has already filed an initial claim and who has experienced a week of unemployment files a continued claim to claim benefits for that week of unemployment. On a weekly basis, continued claims reflect a good approximation of the current number of insured unemployed workers filing for UI benefits, and are a good indicator of labor market conditions. While continued claims are not a leading indicator, they provide confirming evidence of the direction of the economy.
The color-coded map below shows the distribution of this week’s continued claims in Virginia’s counties and cities, expressed as a percentage of each locality’s labor force. This approach provides a more meaningful comparison across areas by adjusting for differences in labor force size. Yellow represents a lower percentage of continued claims relative to the labor force, while progressively darker shades transitioning from yellow to green and dark green indicate higher percentages. The legend at the bottom shows the color spectrum and its corresponding percentage ranges.
Converted Word Document
RICHMOND— Virginia Works – the Commonwealth’s Department of Workforce Development and Advancement – announced today that Virginia’s seasonally adjusted unemployment rate in July increased by 0.1 percentage points to 3.6 percent, which is 0.8 percentage points above the rate from a year ago and 0.6 percentage points below the national rate, which increased by 0.1 percentage points to 4.2 percent. According to Local Area Unemployment Statistics (“the household survey”), the labor force decreased by 6,121 in July to 4,552,304 and the number of employed residents decreased by 8,380 to 4,389,741, as the number of unemployed residents increased by 2,259 to 162,563.
The Commonwealth’s labor force participation rate decreased by 0.1 percentage points to 64.9 percent in July. The labor force participation rate measures the proportion of the civilian population age 16 and older that is employed or actively looking for work.
In July’s Current Employment Statistics Survey, Virginia’s nonagricultural employment increased by 600 to 4,271,700. June’s preliminary estimate of employment, after revision, increased by 2,800 to 4,271,100. In July, private sector employment decreased by 3,600 to 3,507,000 while government employment increased by 4,200 to 764,700. Within that sector, federal government jobs increased by 1,400 to 187,200, state government employment increased by 1,600 to 165,400, and local government increased by 1,200 to 412,100 over the month.
Seasonally adjusted total nonfarm employment data is produced for eleven industry sectors. In July, five experienced over-the-month job gains, and six experienced a decline. The largest job gain occurred in Government (+4,200) to 764,700. The second largest job gain occurred in Education and Health Services (+1,400) to 633,300. The third largest job gain occurred in Leisure and Hospitality (+600) to 417,100. The other gains were in Construction (+500) to 229,500 and Trade, Transportation, and Utilities (+500) to 680,100. The largest job loss occurred in Miscellaneous Services (-2,000) to 205,900. The second largest job loss occurred in Manufacturing (-1,900) to 239,500. The third largest job loss occurred in Professional and Business Services (-1,700) to 804,200. The other losses were in Financial Activities (-600) to 220,300, Information (-300) to 70,100, and Mining and Logging (-100) to 7,000.
Nonfarm Employment in Virginia*
Seasonally Adjusted
Industry
Employment
June 2025 to July 2025
July 2024 to July 2025
July 2025
June 2025
July 2024
Change
% Change
Change
% Change
Total Nonfarm
4,271,700
4,271,100
4,236,300
600
0.0%
35,400
0.8%
Total Private
3,507,000
3,510,600
3,483,700
-3,600
-0.1%
23,300
0.7%
Goods Producing
476,000
477,500
470,400
-1,500
-0.3%
5,600
1.2%
Mining and Logging
7,000
7,100
7,400
-100
-1.4%
-400
-5.4%
Construction
229,500
229,000
219,400
500
0.2%
10,100
4.6%
Manufacturing
239,500
241,400
243,600
-1,900
-0.8%
-4,100
-1.7%
Service-Providing
3,795,700
3,793,600
3,765,900
2,100
0.1%
29,800
0.8%
Private Service Providing
3,031,000
3,033,100
3,013,300
-2,100
-0.1%
17,700
0.6%
Trade, Transportation, and Utilities
680,100
679,600
677,300
500
0.1%
2,800
0.4%
Information
70,100
70,400
70,000
-300
-0.4%
100
0.1%
Financial Activities
220,300
220,900
221,100
-600
-0.3%
-800
-0.4%
Professional and Business Services
804,200
805,900
815,100
-1,700
-0.2%
-10,900
-1.3%
Education and Health Services
633,300
631,900
609,600
1,400
0.2%
23,700
3.9%
Leisure and Hospitality
417,100
416,500
415,500
600
0.1%
1,600
0.4%
Miscellaneous Services
205,900
207,900
204,700
-2,000
-1.0%
1,200
0.6%
Government
764,700
760,500
752,600
4,200
0.6%
12,100
1.6%
Federal Government
187,200
185,800
193,700
1,400
0.8%
-6,500
-3.4%
State Government
165,400
163,800
159,800
1,600
1.0%
5,600
3.5%
Local Government
412,100
410,900
399,100
1,200
0.3%
13,000
3.3%
*Current month’s estimates are preliminary.
From July 2024 to July 2025, Virginia Works estimates that total nonfarm employment in Virginia increased by 35,400 to 4,271,700, private sector employment increased by 23,300 to 3,507,000, and government employment increased by 12,100 to 764,700 jobs. Within that sector, federal government jobs decreased by 6,500 to 187,200, state government employment increased by 5,600 to 165,400, and local government increased by 13,000 to 412,100 over the year.
For the eleven industry sectors in Virginia over the year, seven experienced over-the-year job gains, and four experienced a decline. The largest job gain occurred in Education and Health Services (+23,700) to 633,300. The second largest job gain occurred in Government (+12,100) to 764,700. The third largest job gain occurred in Construction (+10,100) to 229,500. The other gains were in Trade, Transportation, and Utilities (+2,800) to 680,100; Leisure and Hospitality (+1,600) to 417,100; Miscellaneous Services (+1,200) to 205,900; and Information (+100) to 70,100. The largest job loss occurred in Professional and Business Services (-10,900) to 804,200. The second largest job loss occurred in Manufacturing (-4,100) to 239,500. The third largest job loss occurred in Financial Activities (-800) to 220,300. The other loss was in Mining and Logging (-400) to 7,000.
Nonfarm Employment in Virginia*
Seasonally Adjusted
Area
Employment
June 2025 to July 2025
July 2024 to July 2025
July 2025
June 2025
July 2024
Change
% Change
Change
% Change
Virginia
4,271,700
4,271,100
4,236,300
600
0.0%
35,400
0.8%
Arlington-Alexandria MSA
1,632,500
1,632,400
1,623,300
100
0.0%
9,200
0.6%
Blacksburg-Christiansburg-Radford MSA
82,900
82,900
82,900
0
0.0%
0
0.0%
Charlottesville MSA
125,600
125,400
124,300
200
0.2%
1,300
1.0%
Harrisonburg MSA
71,800
71,400
72,000
400
0.6%
-200
-0.3%
Lynchburg MSA
104,700
105,000
103,900
-300
-0.3%
800
0.8%
Richmond MSA
733,500
733,200
721,400
300
0.0%
12,100
1.7%
Roanoke MSA
168,800
168,600
167,500
200
0.1%
1,300
0.8%
Staunton MSA
53,900
54,000
53,800
-100
-0.2%
100
0.2%
Virginia Beach-Chesapeake-Norfolk MSA
820,600
821,500
821,700
-900
-0.1%
-1,100
-0.1%
Winchester MSA
74,300
74,200
73,000
100
0.1%
1,300
1.8%
*Current month’s estimates are preliminary.
Seasonally adjusted total nonfarm employment data is produced for ten metropolitan areas. In July, six experienced over-the-month job gains, one remained unchanged, and three experienced a decline. The largest job gain occurred in Harrisonburg (+400) to 71,800. The second largest job gain occurred in Richmond (+300) to 733,500. The third largest job gain occurred in Charlottesville (+200) to 125,600. The other gains were in Roanoke (+200) to 168,800, Arlington-Alexandria (+100) to 1,632,500, and Winchester (+100) to 74,300. The largest job loss occurred in Virginia Beach-Chesapeake-Norfolk (-900) to 820,600. The second largest job loss occurred in Lynchburg (-300) to 104,700. The third largest job loss occurred in Staunton (-100) to 53,900. Blacksburg-Christiansburg-Radford remained unchanged.
Over the year, seven metro areas experienced over-the-year job gains, one remained unchanged, and two experienced a decline. The largest job gain occurred in Richmond (+12,100) to 733,500. The second largest job gain occurred in Arlington-Alexandria (+9,200) to 1,632,500. The third largest job gain occurred in Charlottesville (+1,300) to 125,600 and Roanoke (+1,300) to 168,800. The other gains were in Winchester (+1,300) to 74,300, Lynchburg (+800) to 104,700, and Staunton (+100) to 53,900. The largest job loss occurred in Virginia Beach-Chesapeake-Norfolk (-1,100) to 820,600. The second largest job loss occurred in Harrisonburg (-200) to 71,800. Blacksburg-Christiansburg-Radford remained unchanged.
Not Seasonally Adjusted Data
Virginia’s unadjusted unemployment rate decreased by 0.1 percentage points to 3.8 percent in July. It has increased by 0.6 percentage points compared to last year. Compared to a year ago, the number of unemployed increased by 25,094 to 173,998, household employment decreased by 75,370 to 4,414,341, and the labor force decreased by 50,276 to 4,588,339. Virginia’s not seasonally adjusted unemployment rate is 0.8 percentage points below the national unadjusted rate, which increased by 0.2 percentage points to 4.6 percent.
Compared to last month, the July unadjusted workweek for Virginia’s 155,800 manufacturing production workers remained unchanged at 38.4 hours. Average hourly earnings of private-sector production workers decreased by $0.04 to $28.72, and average weekly earnings decreased by $1.53 to $1,102.85.
###
Technical note: Estimates of unemployment and industry employment levels are obtained from two separate monthly surveys. Resident employment and unemployment data are mainly derived from the Virginia portion of the national Current Population Survey (CPS), a household survey conducted each month by the U.S. Census Bureau under contract with BLS, which provides input to the Local Area Unemployment Statistics (LAUS) program (often referred to as the “household” survey). Industry employment data is mainly derived from the Current Employment Statistics (CES) survey, a monthly survey of approximately 18,000 Virginia businesses conducted by BLS, which provides estimates of employment, hours, and earnings data broken down by industry for the nation as a whole, all states and most major metropolitan areas (often referred to as the “establishment” survey). Both industry and household estimates are revised each month based on additional information from updated survey reports compiled by the BLS. For national figures and information on how COVID-19 affected collection of the BLS establishment and household surveys in April 2020, refer to the BLS July Employment Situationpress release for details.
The statistical reference week for the household survey this month was the week of July 6-12, 2025
Virginia Works plans to release the July local area unemployment rates on Wednesday August 27, 2025. The data will be available on our website www.VirginiaWorks.com. The August 2025 statewide unemployment rate and employment data for both the state and metropolitan areas are scheduled to be released on Friday September 19, 2025.
RICHMOND— Virginia Works announced today that 2,615 unemployment insurance weekly initial claims were filed during the week ending August 02, 2025, which is 5.0 percent higher than last week’s 2,490 claims and 35.0 percent higher than the comparable week of last year (1,937). Nearly 82 percent of claimants self-reported an employer which correlates to an associated industry. Based on this reporting, the top five industries (62 percent) were Professional, Scientific, and Technical Services (372); Manufacturing (260); Administrative and Support and Waste Management (241); Health Care and Social Assistance (213); and Retail Trade (196).
Continued weeks claims (21,488) were 0.1 percent higher than last week (21,457) and were 27.2 percent higher than the comparable week of last year (16,893). Nearly 93 percent of claimants self-reported an employer which correlates to an associated industry. Based on this reporting, the top five industries (62 percent) were Professional, Scientific, and Technical Services (4,836); Administrative and Support and Waste Management (2,463); Health Care and Social Assistance (1,973); Manufacturing (1,573); and Retail Trade (1,558).
Significant Layoffs and Announcements are available at the following websites:
Initial Claims – Comparison of Unemployment Insurance Activity
Week Ending08/02/2025
Week Ending07/26/2025
Week Ending07/19/2025
Last Year08/03/2024
Initial Claims
2,615
2,490
2,600
1,937
Initial Change (%)
+125 (+5.0%)
-110 (-4.2%)
-846 (-24.6%)
+678 (+35.0%)
Continued Claims
21,488
21,457
21,308
16,893
Virginia Continued Weeks Claimed as a Percentage of Total Workforce
A person who has already filed an initial claim and who has experienced a week of unemployment files a continued claim to claim benefits for that week of unemployment. On a weekly basis, continued claims reflect a good approximation of the current number of insured unemployed workers filing for UI benefits, and are a good indicator of labor market conditions. While continued claims are not a leading indicator, they provide confirming evidence of the direction of the economy.
The color-coded map below shows the distribution of this week’s continued claims in Virginia’s counties and cities, expressed as a percentage of each locality’s labor force. This approach provides a more meaningful comparison across areas by adjusting for differences in labor force size. Yellow represents a lower percentage of continued claims relative to the labor force, while progressively darker shades transitioning from yellow to green and dark green indicate higher percentages. The legend at the bottom shows the color spectrum and its corresponding percentage ranges.
RICHMOND— Virginia Works announced today that 2,837 unemployment insurance weekly initial claims were filed during the week ending July 05, 2025, which is 6.1 percent higher than last week’s 2,674 claims and 32.8 percent higher than the comparable week of last year (2,136). Nearly 80 percent of claimants self-reported an employer which correlates to an associated industry. Based on this reporting, the top five industries (64 percent) were Professional, Scientific, and Technical Services (405); Manufacturing (322); Administrative and Support and Waste Management (253); Health Care and Social Assistance (220); and Retail Trade (165).
Continued weeks claims (20,422) were 0.8 percent lower than last week (20,587) and were 24.0 percent higher than the comparable week of last year (16,471). Nearly 93 percent of claimants self-reported an employer which correlates to an associated industry. Based on this reporting, the top five industries (62 percent) were Professional, Scientific, and Technical Services (4,507); Administrative and Support and Waste Management (2,362); Health Care and Social Assistance (1,877); Retail Trade (1,493); and Manufacturing (1,398).
Significant Layoffs and Announcements are available at the following websites:
Initial Claims – Comparison of Unemployment Insurance Activity
Week Ending07/05/2025
Week Ending06/28/2025
Week Ending06/21/2025
Last Year07/06/2024
Initial Claims
2,837
2,674
2,766
2,136
Initial Change (%)
+163 (+6.1%)
-92 (-3.3%)
-1,206 (-30.4%)
+701 (+32.8%)
Continued Claims
20,422
20,587
21,399
16,471
Virginia Continued Weeks Claimed as a Percentage of Total Workforce
A person who has already filed an initial claim and who has experienced a week of unemployment files a continued claim to claim benefits for that week of unemployment. On a weekly basis, continued claims reflect a good approximation of the current number of insured unemployed workers filing for UI benefits, and are a good indicator of labor market conditions. While continued claims are not a leading indicator, they provide confirming evidence of the direction of the economy.
The color-coded map below shows the distribution of this week’s continued claims in Virginia’s counties and cities, expressed as a percentage of each locality’s labor force. This approach provides a more meaningful comparison across areas by adjusting for differences in labor force size. Yellow represents a lower percentage of continued claims relative to the labor force, while progressively darker shades transitioning from yellow to green and dark green indicate higher percentages. The legend at the bottom shows the color spectrum and its corresponding percentage ranges.
RICHMOND— Virginia Works announced today that 2,674 unemployment insurance weekly initial claims were filed during the week ending June 28, 2025, which is 3.3 percent lower than last week’s 2,766 claims and 26.6 percent higher than the comparable week of last year (2,112). Nearly 82 percent of claimants self-reported an employer which correlates to an associated industry. Based on this reporting, the top five industries (61 percent) were Professional, Scientific, and Technical Services (353); Health Care and Social Assistance (243); Administrative and Support and Waste Management (215); Manufacturing (212); and Retail Trade (188).
Continued weeks claims (20,587) were 3.8 percent lower than last week (21,399) and were 25.3 percent higher than the comparable week of last year (16,433). Nearly 92 percent of claimants self-reported an employer which correlates to an associated industry. Based on this reporting, the top five industries (62 percent) were Professional, Scientific, and Technical Services (4,487); Administrative and Support and Waste Management (2,397); Health Care and Social Assistance (1,837); Retail Trade (1,510); and Manufacturing (1,490).
Significant Layoffs and Announcements are available at the following websites:
Initial Claims – Comparison of Unemployment Insurance Activity
Week Ending06/28/2025
Week Ending06/21/2025
Week Ending06/14/2025
Last Year06/29/2024
Initial Claims
2,674
2,766
3,972
2,112
Initial Change (%)
-92 (-3.3%)
-1,206 (-30.4%)
+637 (+19.1%)
+562 (+26.6%)
Continued Claims
20,587
21,399
20,128
16,433
Virginia Continued Weeks Claimed as a Percentage of Total Workforce
A person who has already filed an initial claim and who has experienced a week of unemployment files a continued claim to claim benefits for that week of unemployment. On a weekly basis, continued claims reflect a good approximation of the current number of insured unemployed workers filing for UI benefits, and are a good indicator of labor market conditions. While continued claims are not a leading indicator, they provide confirming evidence of the direction of the economy.
The color-coded map below shows the distribution of this week’s continued claims in Virginia’s counties and cities, expressed as a percentage of each locality’s labor force. This approach provides a more meaningful comparison across areas by adjusting for differences in labor force size. Yellow represents a lower percentage of continued claims relative to the labor force, while progressively darker shades transitioning from yellow to green and dark green indicate higher percentages. The legend at the bottom shows the color spectrum and its corresponding percentage ranges.
RICHMOND— Virginia Works announced today that 3,335 unemployment insurance weekly initial claims were filed during the week ending June 07, 2025, which is 18.0 percent higher than last week’s 2,827 claims and 31.8 percent higher than the comparable week of last year (2,531). Nearly 80 percent of claimants self-reported an employer which correlates to an associated industry. Based on this reporting, the top five industries (65 percent) were Professional, Scientific, and Technical Services (473); Manufacturing (419); Administrative and Support and Waste Management (274); Health Care and Social Assistance (249); and Accommodation and Food Services (248).
Continued weeks claims (19,596) were 2.9 percent lower than last week (20,185) and were 24.3 percent higher than the comparable week of last year (15,761). Nearly 92 percent of claimants self-reported an employer which correlates to an associated industry. Based on this reporting, the top five industries (62 percent) were Professional, Scientific, and Technical Services (4,168); Administrative and Support and Waste Management (2,327); Health Care and Social Assistance (1,668); Manufacturing (1,510); and Retail Trade (1,445).
Significant Layoffs and Announcements are available at the following websites:
Initial Claims – Comparison of Unemployment Insurance Activity
Week Ending06/07/2025
Week Ending05/31/2025
Week Ending05/24/2025
Last Year06/08/2024
Initial Claims
3,335
2,827
3,662
2,531
Initial Change (%)
+508 (+18.0%)
-835 (-22.8%)
+947 (+34.9%)
+804 (+31.8%)
Continued Claims
19,596
20,185
19,652
15,761
Virginia Continued Weeks Claimed as a Percentage of Total Workforce
A person who has already filed an initial claim and who has experienced a week of unemployment files a continued claim to claim benefits for that week of unemployment. On a weekly basis, continued claims reflect a good approximation of the current number of insured unemployed workers filing for UI benefits, and are a good indicator of labor market conditions. While continued claims are not a leading indicator, they provide confirming evidence of the direction of the economy.
The color-coded map below shows the distribution of this week’s continued claims in Virginia’s counties and cities, expressed as a percentage of each locality’s labor force. This approach provides a more meaningful comparison across areas by adjusting for differences in labor force size. Yellow represents a lower percentage of continued claims relative to the labor force, while progressively darker shades transitioning from yellow to green and dark green indicate higher percentages. The legend at the bottom shows the color spectrum and its corresponding percentage ranges.