RICHMOND Virginia Works (the
Virginia Department of Workforce Development and Advancement) announced today
that the U.S. Bureau of Labor Statistics (BLS) December 2025 Job Openings and
Labor Turnover Survey (JOLTS) reports lower numbers of layoffs and discharges.
On
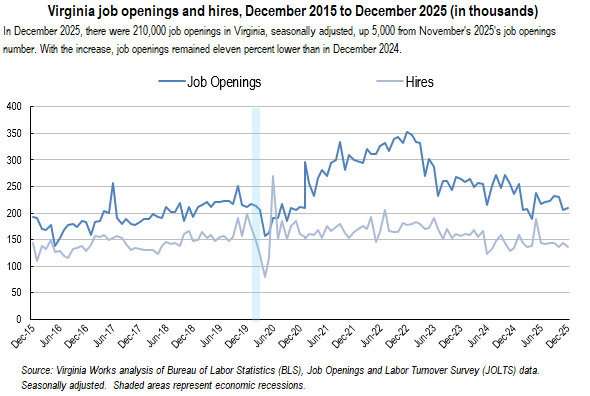
the last business day in December, there were 210,000 job openings in
Virginia, seasonally adjusted, an increase of 5,000 from November s revised figure.
Job openings were eleven percent lower than December 2024 s figure. Nationwide,
the number of job openings trended down to 6.5 million (-386,000) in December
and was down by 966,000 over the year. The number of job openings decreased in
professional and business services (-257,000), retail trade (-195,000), and
finance and insurance (-120,000). Nationwide, the job openings rate was 3.9
percent.
The
number of hires in Virginia was 136,000 in December, an 8,000 decrease
from November s figure but, essentially, unchanged over the year. JOLTS defines
hires as all additions to the payroll during the month. In December, the
number of U.S. hires was little changed at 5.3 million. The number of hires
increased in real estate
and
rental and leasing (+38,000) and in state and local government, excluding
education (+36,000). Hires decreased in federal government (-11,000). The U.S.
rate of hires nationwide was little changed at 3.3 percent.
The
Virginia hires‑per‑job‑opening (HPJO) ratio remained
steady in December at two hires for every three job openings. This
metric reflects the pace of hiring relative to available positions and serves
as a proxy for the time it takes employers to fill vacancies. Also in December,
the unemployed-per-job-opening ratio was eight unemployed individuals for every
ten job openings in Virginia, compared to the national ratio of eleven
unemployed for every ten job openings.
Total
job
separations in Virginia fell to 145,000, 17,000 lower
over the month. Nationwide, total job separations in December were little
changed at 5.3 million. The Virginia total separations rate fell
to 3.4 percent. Nationwide, the total separations rate remained little changed
at 3.3 percent. The number of total separations decreased in professional and
business services (-212,000) and in private educational services (-20,000).
Total separations increased in transportation, warehousing, and utilities
(+110,000) and in federal government (+10,000).
An
estimated 90,000 workers quit jobs ( quits ) from Virginia employers in December.
Nationwide, the number of quits was unchanged at 3.2 million. The number of
quits decreased in professional and business services (-151,000) and in private
educational services (-19,000). Quits increased in retail trade (+87,000) and
in
information
(+28,000). The quits rate in the Commonwealth was little changed at 2.1
percent. Over the month, the U.S. quits rate was little changed at 2.0 percent.
The December churn rate (the sum of
the hires and total separations rates) in Virginia decreased by 0.6 points from
November s revised figure to 6.6 percent and was driven
by decreases in hires, job quits, and layoffs. It equaled the U.S. churn rate,
which was little changed over the month.
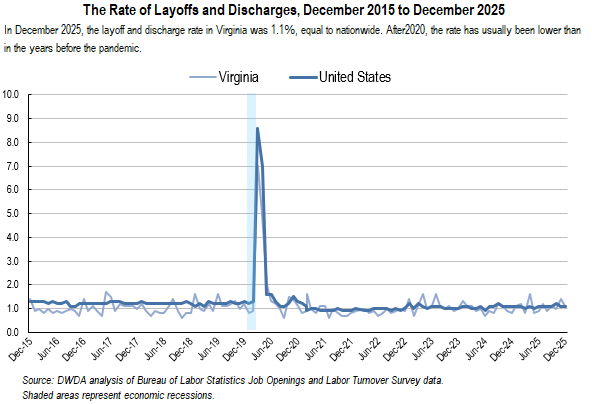
The
number of layoffs and discharges in Virginia was 47,000 in December, a decrease
of 13,000 from November s estimate. The number of U.S. layoffs and discharges
in December was little changed at 1.8 million. The layoffs and discharges rate
was unchanged at 1.1 percent. Layoffs and discharges increased in
transportation, warehousing, and utilities (+103,000) but decreased in finance
and insurance (-20,000). The Virginia layoffs and discharges rate fell
to 1.1 percent. In December, the U.S. rate of layoffs and discharges was little
changed at 1.1 percent.
On
the last business day of December, JOLTS data indicated the number of Layoffs
and Discharges decreased to 47,000. While this was nearly 40 percent higher
than in December 2024, recent years figures remained, on the whole, within the
range seen over the last decade.
BLS s
JOLTS data provides information on all the components that make up the net
change in the number of jobs over a month, including job openings, hires,
layoffs, voluntary quits, and other job separations (including retirements and
worker deaths). Together, these components attempt to reveal the overall change
in payroll employment. JOLTS data is seasonally adjusted and describes
conditions on the last business day of the month. The current month s data is
preliminary and the previous month s data has been revised.
|
Job Openings
Job openings include all positions that
are open on the last business day of the reference month. A job is open only
if it meets the following three conditions: (1) A specific position exists
and there is work available for that position; the position can be full time
or part time, and it can be permanent, short term, or seasonal; (2) the job
could start within 30 days, whether or not the employer can find a suitable
candidate during that time; and (3) the employer is actively recruiting
workers from outside the establishment to fill the position. Excluded are
positions open only to internal transfers, promotions or demotions, or
recalls from layoffs.
Hires
Hires include all additions to the payroll
during the entire reference month, including newly hired and rehired
employees; full-time and part-time employees; permanent, short-term, and
seasonal employees; employees who were recalled to a job at the location
following a layoff (formal suspension from pay status) lasting more than 7
days; on-call or intermittent employees who returned to work after having
been formally separated; workers who were hired and separated during the
month; and transfers from other locations. Excluded are transfers or
promotions within the reporting location, employees returning from a strike,
and employees of temporary help agencies, employee leasing companies, outside
contractors, or consultants.
Separations
Separations include all separations from
the payroll during the entire reference month and are reported by type of
separation: quits, layoffs and discharges, and other separations. Quits
include employees who leave voluntarily, except for retirements or transfers
to other locations. Layoffs and discharges include involuntary separations
initiated by the employer, including layoffs with no intent to rehire;
layoffs (formal suspensions from pay status) lasting or expected to last more
than 7 days; discharges resulting from mergers, downsizing, or closings;
firings or other discharges for cause; terminations of permanent or
short-term employees; and terminations of seasonal employees (whether or not
they are expected to return the next season). Other separations include
retirements, transfers to other locations, separations due to employee
disability, and deaths. Excluded are transfers within the same location,
employees on strike, and employees of temporary help agencies, employee
leasing companies, outside contractors, or consultants.
*Excerpted from U.S. Bureau of Labor
Statistics, Handbook of Methods, "Job Openings and Labor Turnover
Survey: Concepts," https://www.bls.gov/opub/hom/jlt/concepts.htm.
|
NOTICE: The State Job
Openings and Labor Turnover news release will move from a monthly news release
to an annual news release, according to a BLS announcement. The State Job
Openings and Labor Turnover news release will move from a monthly news release
to an annual news release. The first annual news release will be in July 2026.
Going forward, monthly estimates for the prior calendar year will be published
each year along with the annual news release. The annual news release will
incorporate benchmark revisions to JOLTS national estimates, updated Current
Employment Statistics (CES) employment estimates, and updated Quarterly Census
of Employment and Wages (QCEW) data. Data for all states and the U.S. will be
available on the BLS website JOLTS page, at https://www.bls.gov/jlt/.