July 23, 2020
RICHMOND—The Virginia Employment Commission (VEC) announced that the total number of initial claims filed from the beginning of the pandemic in Mid-March of 2020 through the July 18, 2020 filing week surpassed one million initial claims.
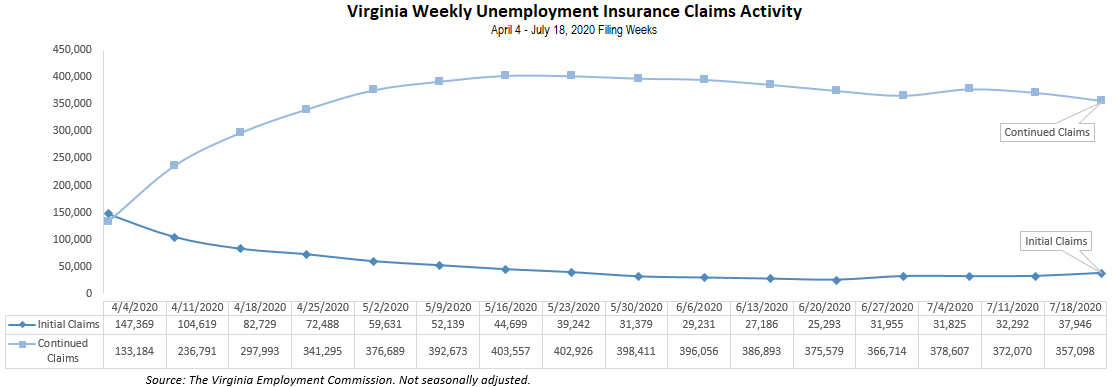
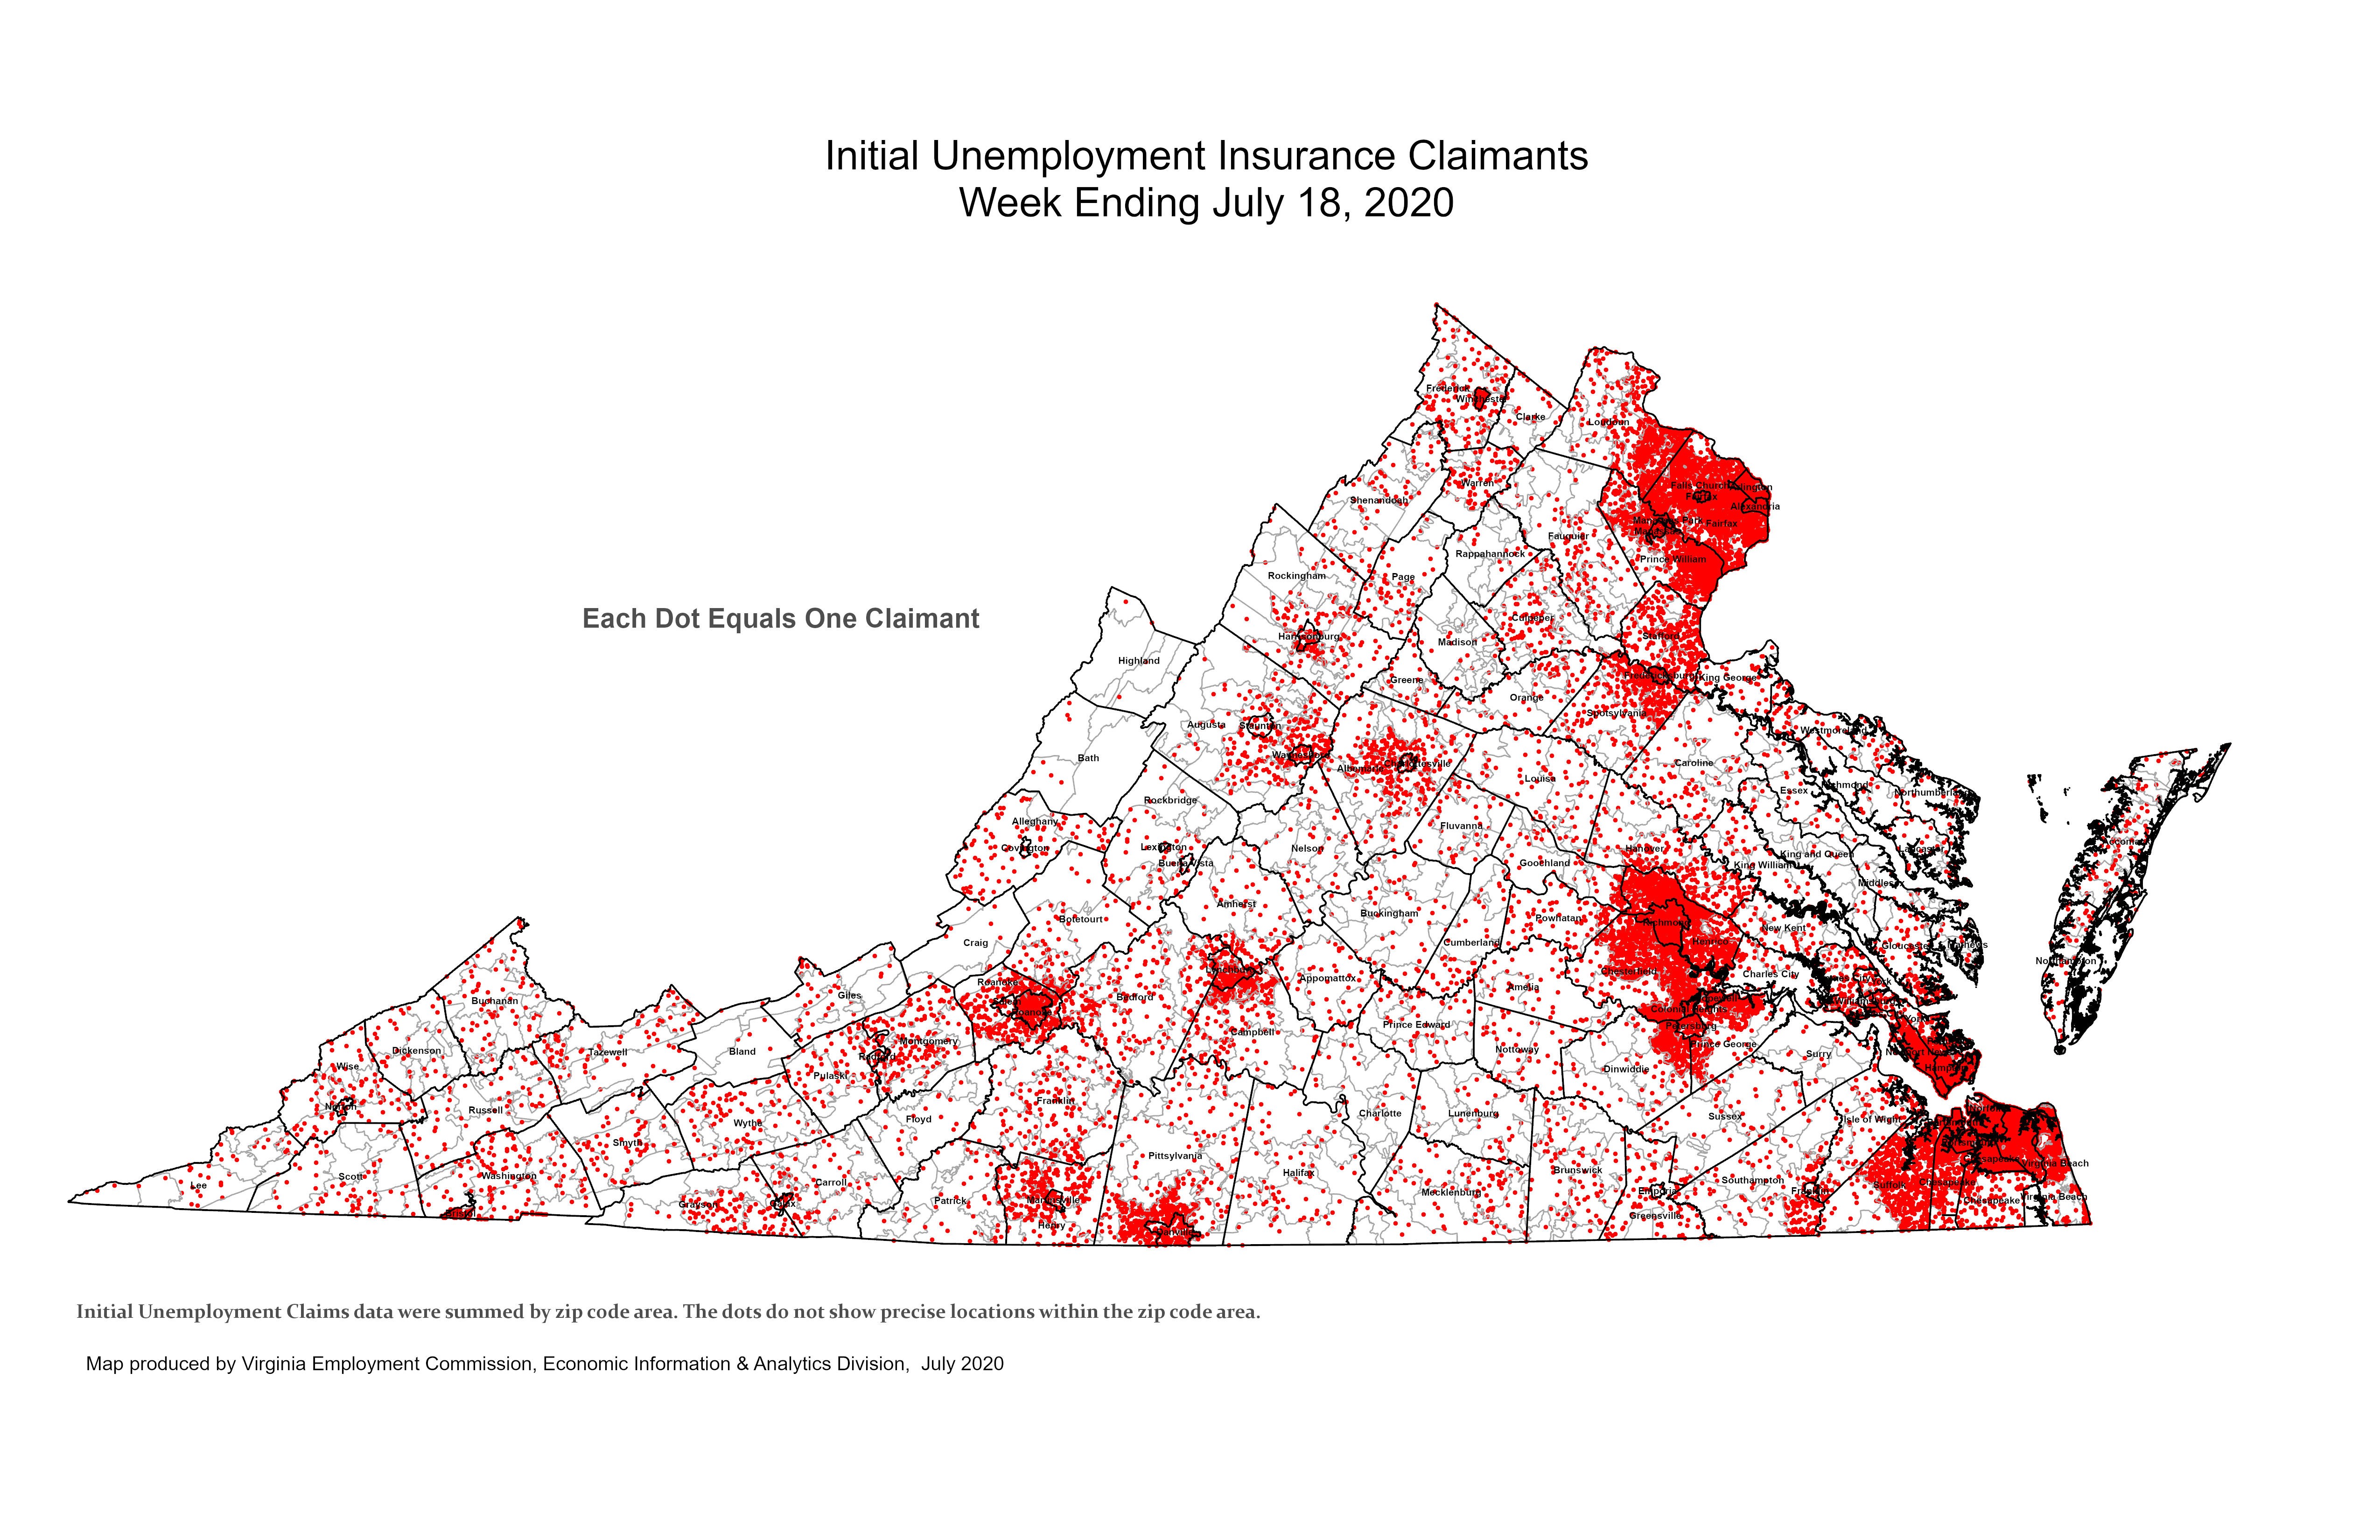
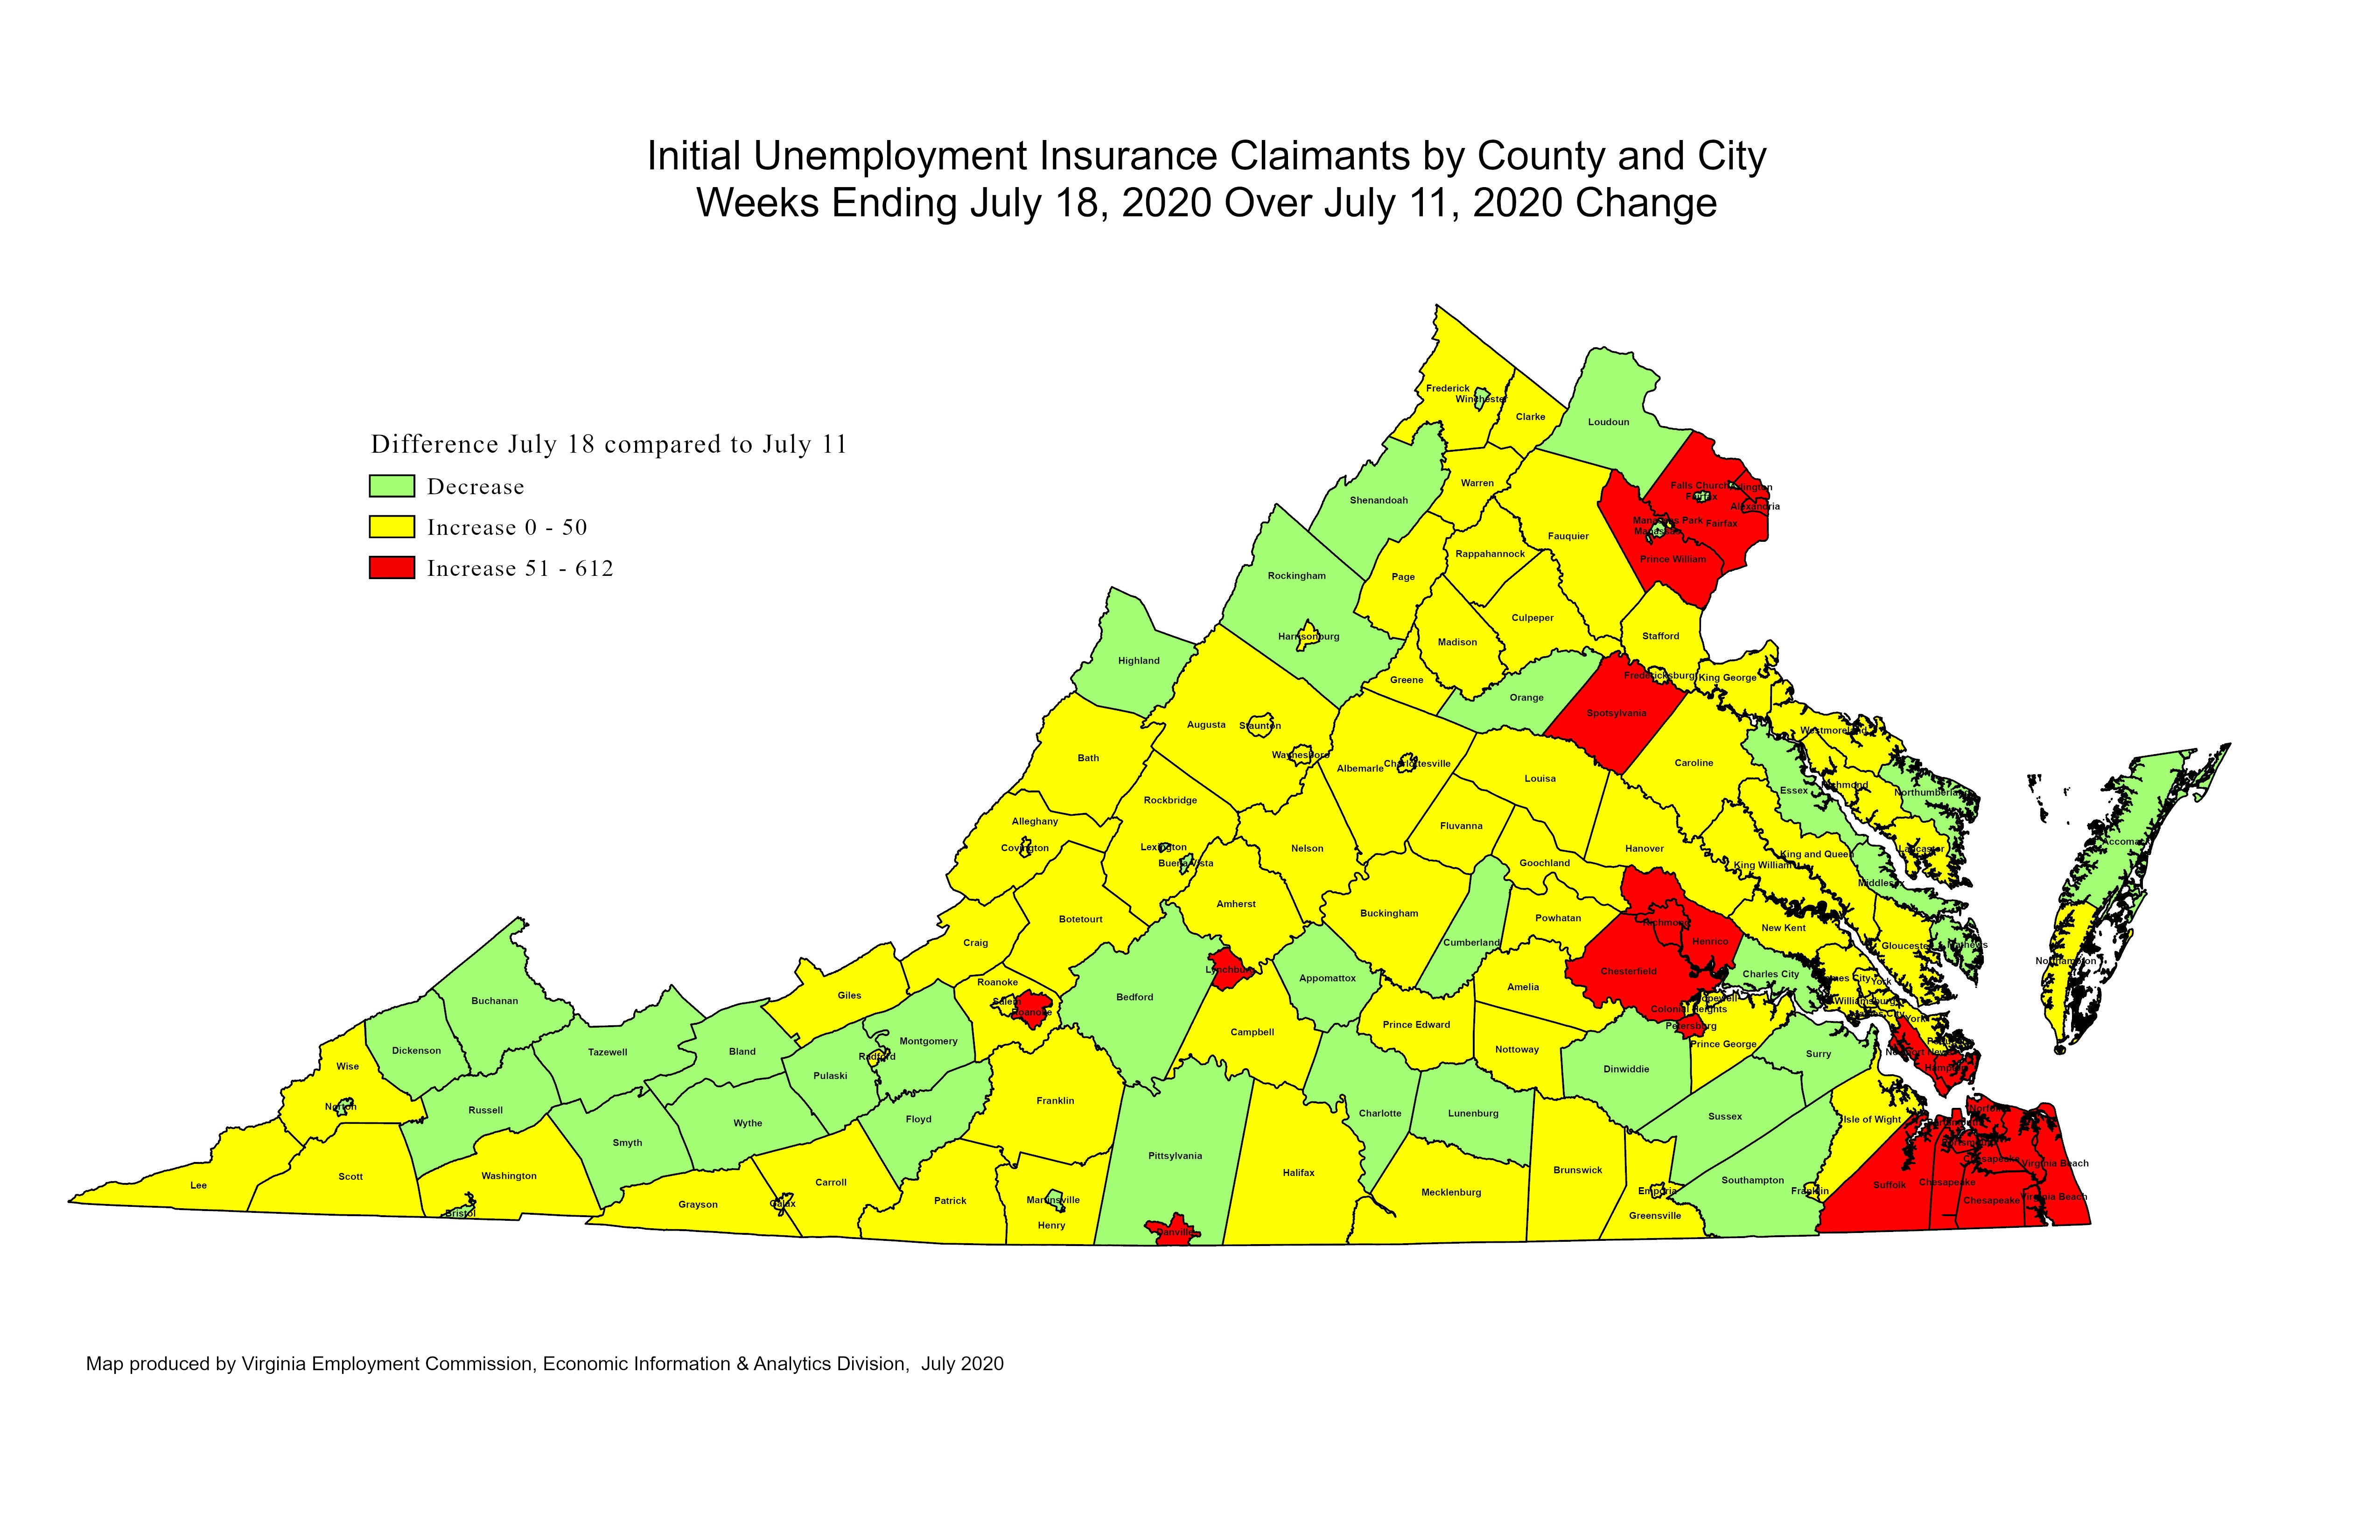
For the filing week ending July 18, the figure for seasonally unadjusted initial claims in Virginia was 37,946. The latest claims figure was an increase of 5,654 claimants from the previous week and rose to its highest level since May.
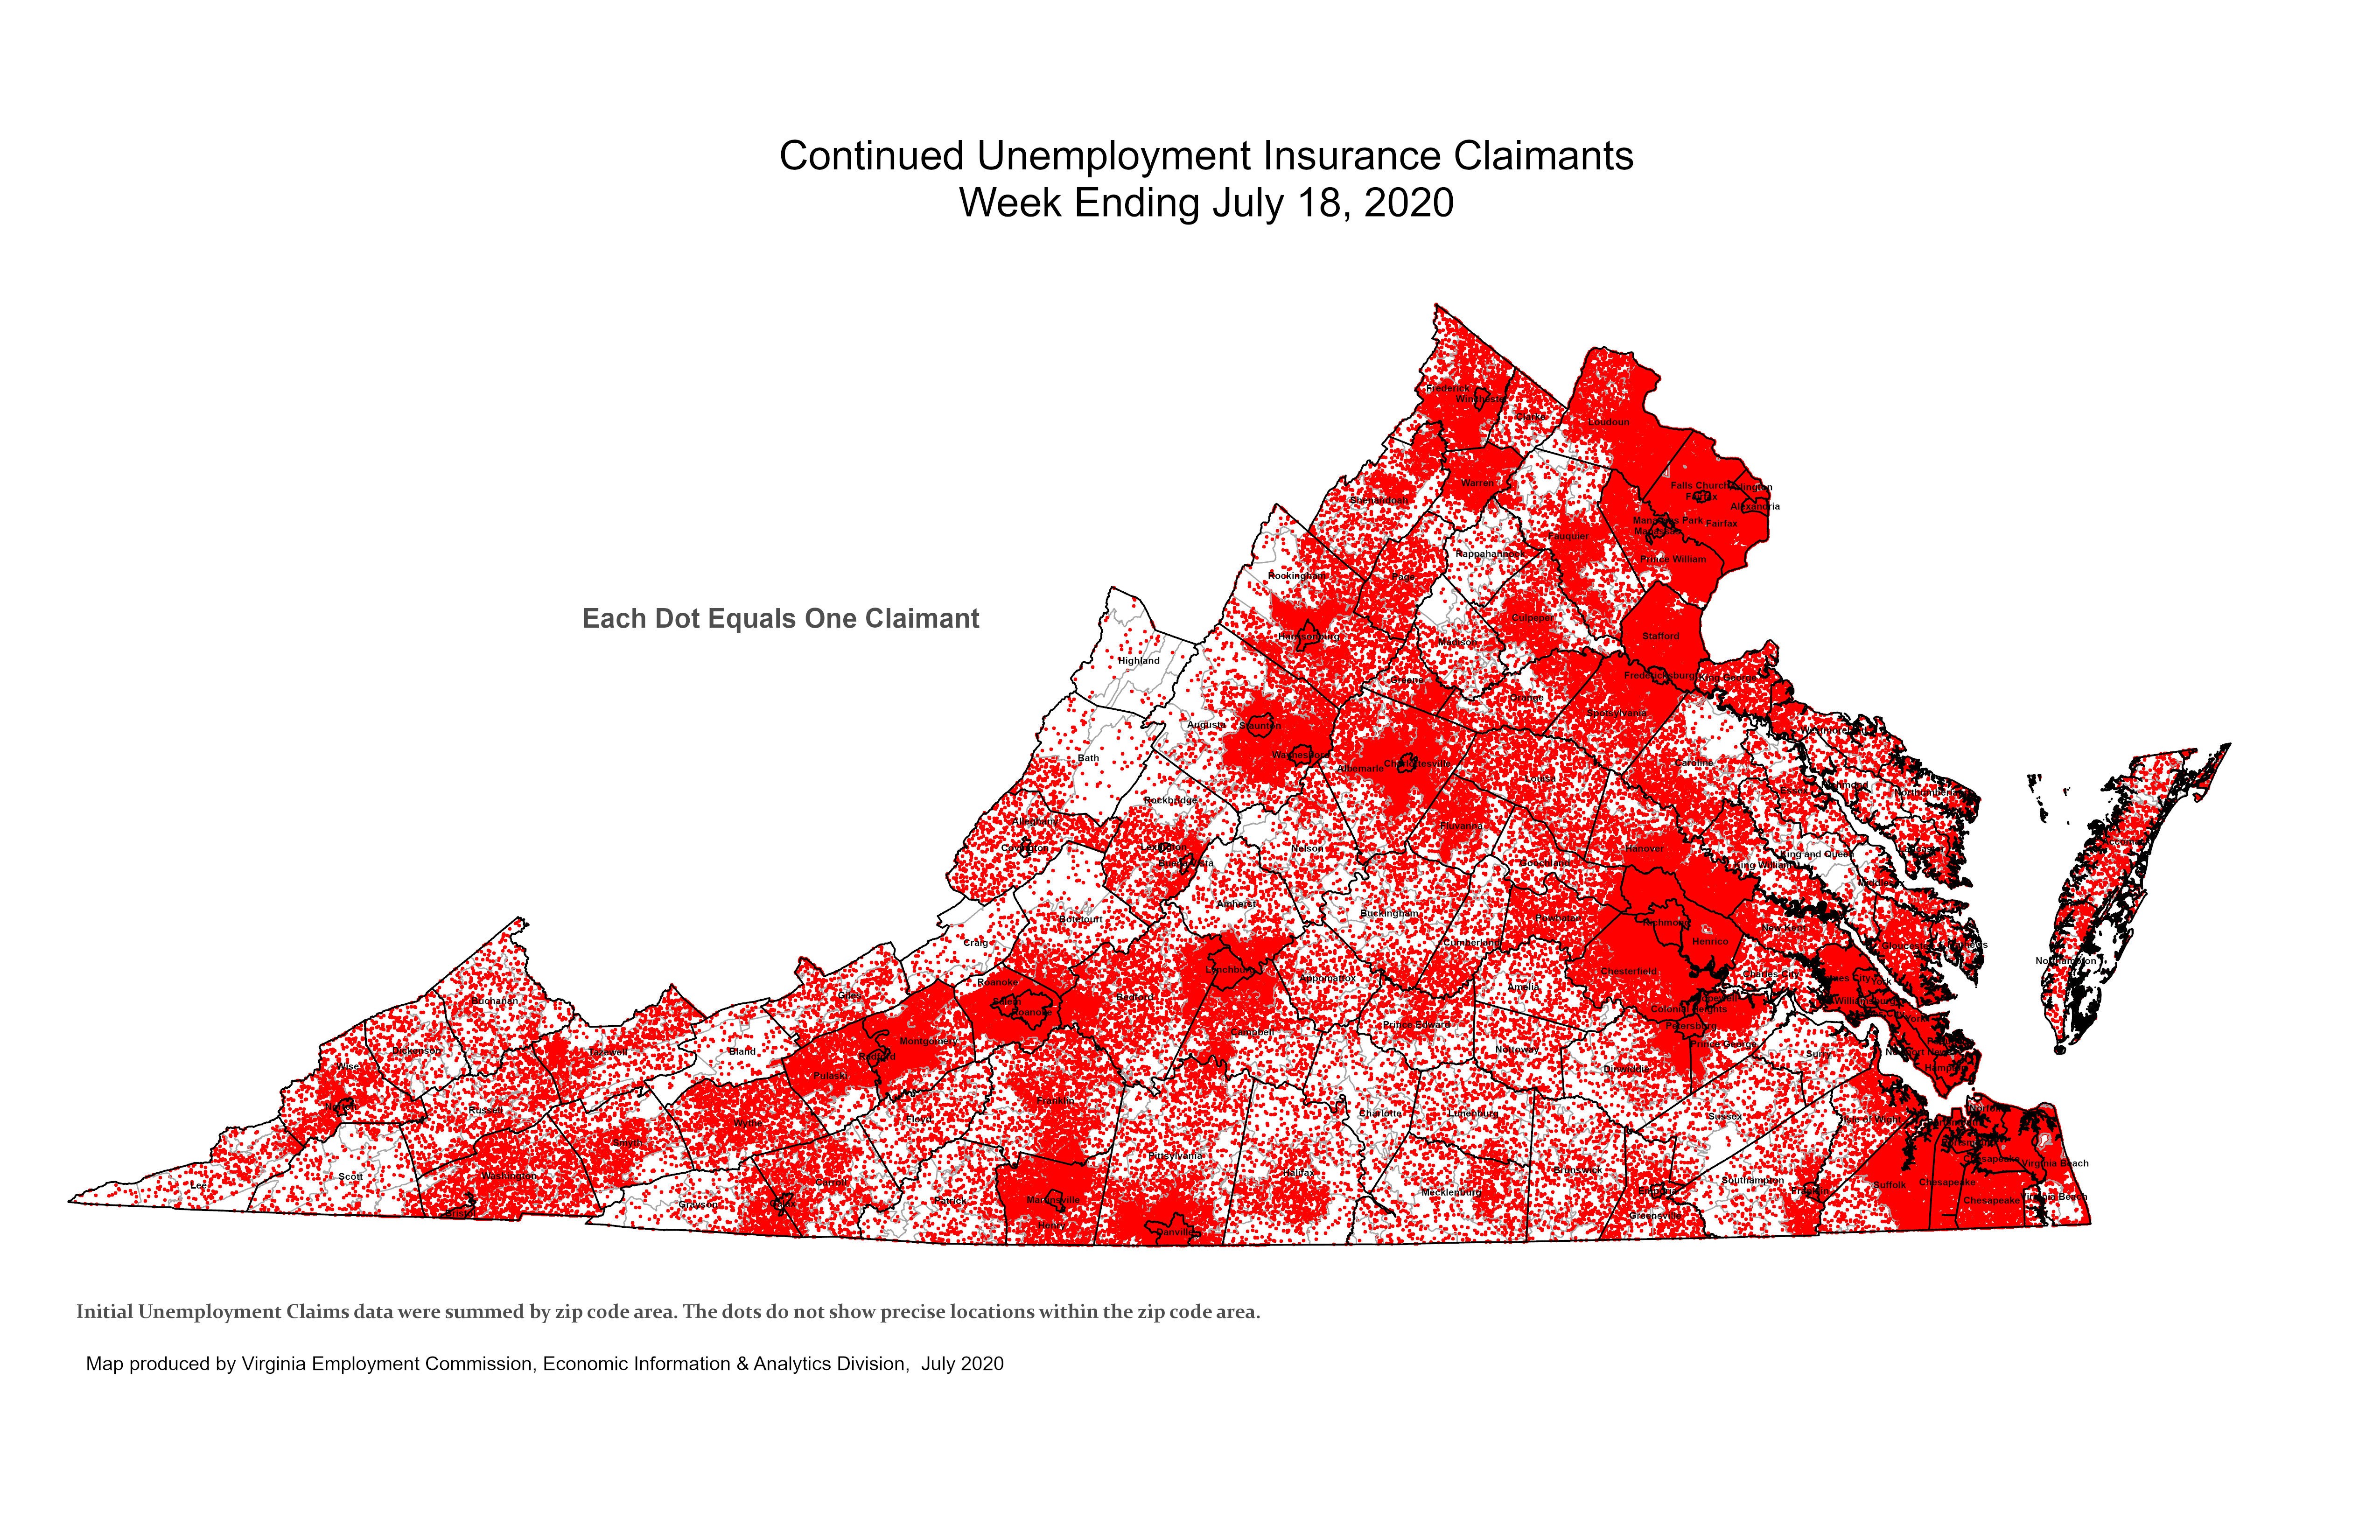
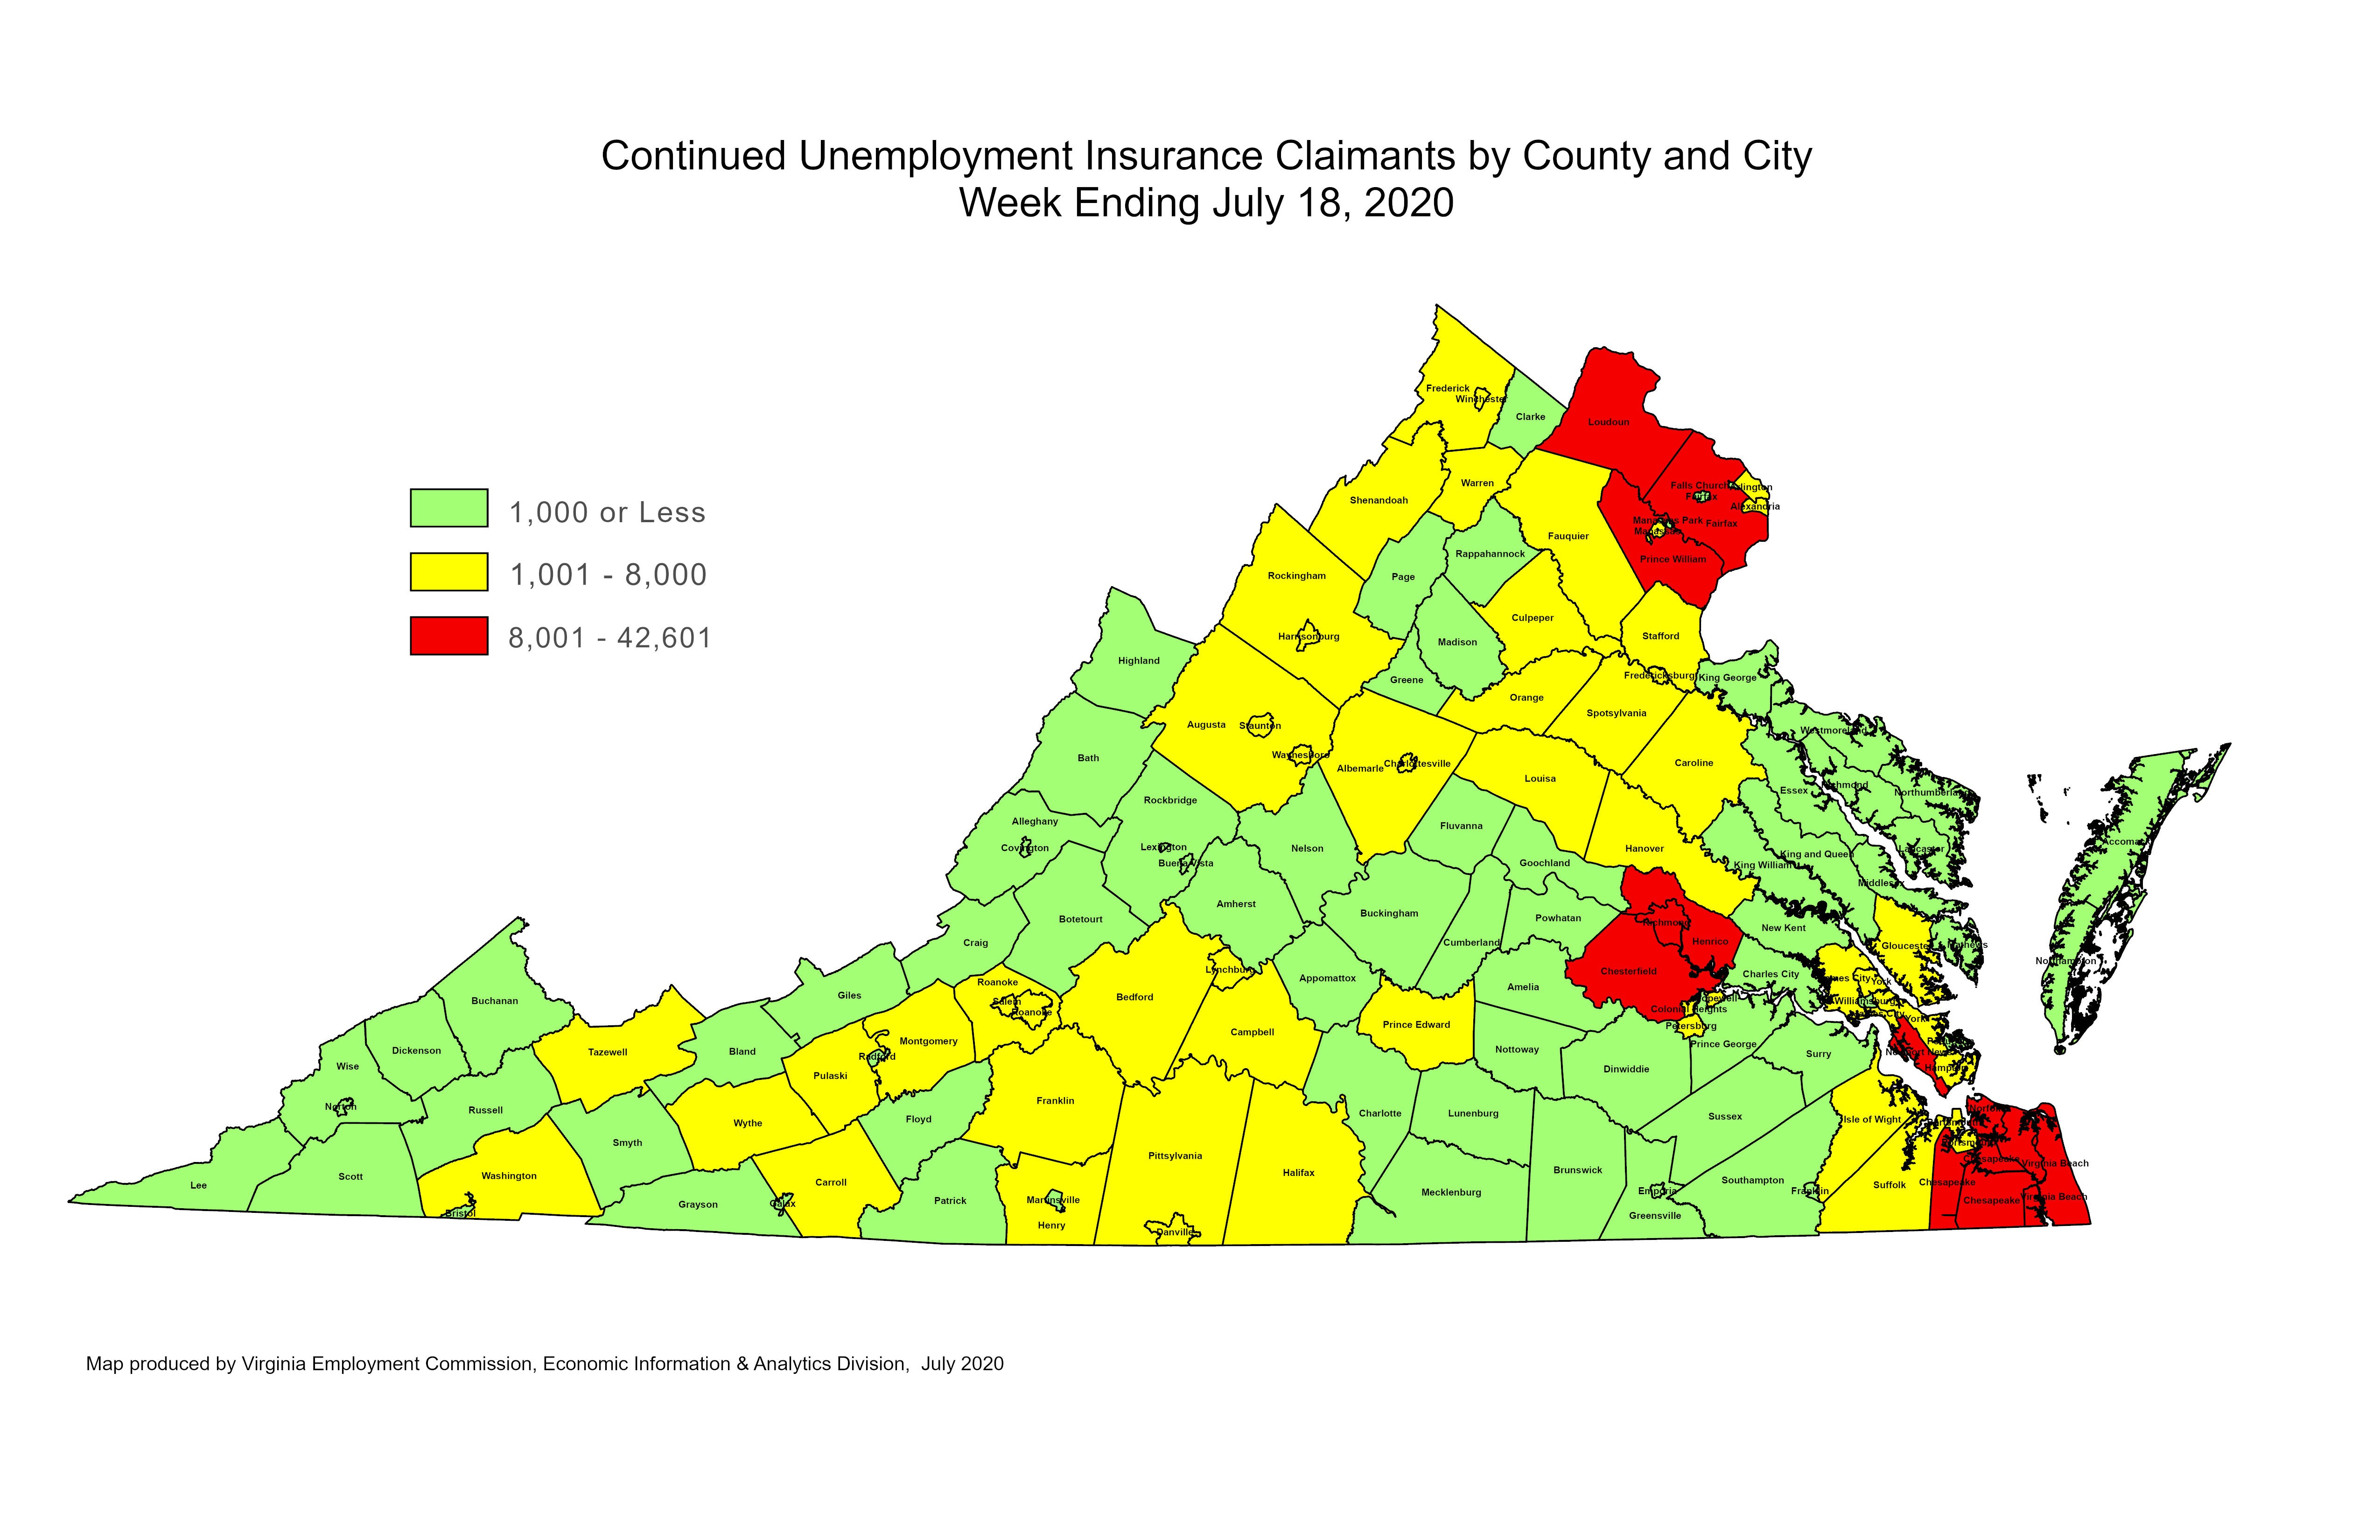
For the most recent filing week, continued weeks claimed totaled 357,098, down 14,972 from the previous week, but 337,023 higher than the 20,075 continued claims from the comparable week last year. They have trended downward in the last month and fell to their lowest level since April during the most recent filing week. The continued claims total is mainly comprised of those recent initial claimants who continued to file for unemployment insurance benefits during the COVID-19 pandemic.
For additional information on who is claiming unemployment insurance in Virginia, access the VEC’s U.I. claims data dashboard (https://www.vec.virginia.gov/ui-claims-dashboard) that is updated no later than the following Monday after the weekly claims press release.
Nationwide, in the week ending July 18, the advance figure for seasonally adjusted initial claims was 1,416,000, an increase of 109,000 from the previous week’s revised level. The previous week’s level was revised up by 7,000 from 1,300,000 to 1,307,000. The advance number of actual initial claims under state programs, unadjusted, totaled 1,370,947 in the week ending July 18, a decrease of 141,816 (or -9.4 percent) from the previous week. There were 196,382 initial claims in the comparable week in 2019. Looking at preliminary data, most states reported decreases while fifteen states reported weekly increases on a seasonally unadjusted basis. Virginia’s preliminary weekly change (+7,896) was the largest increase among states. Others included California (+7,759), Louisiana (+4,804), Nevada (+4,109), and Tennessee (+3,734).
 PDF of Press Release